|
|
|
Spatial Patterns of Food
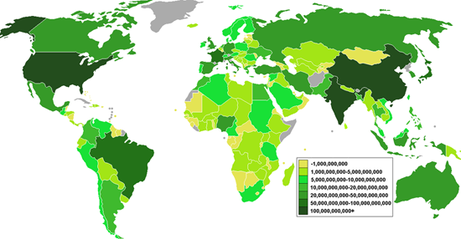
Food Production by value 2006
Global food production is not evenly distributed. Food production is influenced by two main drivers, environmental capacity and human capacity. Environmental capacity is influenced by the physical environment, most notably, climate, water availability and soil type. Human capacity refers to both the population size and skills in regard to agriculture and the financial capital a country can invest into agricultural infrastructure. The map to the left shows the value of food production in USD for 2006. A clear pattern is observed in terms of population size and wealth of countries. Countries with vast human resources like China and India have agricultural output values in excess of $100 billion. The USA, Brazil and the European Union, (particuarly France) have very large output value. This is largely due to the intensification of farmimg methods and large capital investments. In contrast smaller countries and less developed countries, like those found in Sub-Saharan Africa produce less food. However, it is important to look at the trends in growth by region.
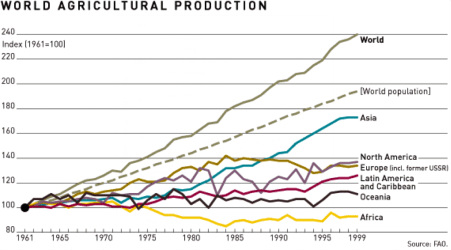
Food Production by Region.
Source: Waugh
The production of food by region between 1961 and 1999 is shown in the following graph. It shows a number of patterns, which will be explained through this section of the site. Firstly, it is important to understand the graph. The index of 100 refers to the base level of production in 1961. Therefore, any movement away from the base level can be seen as a percentage change. For example, world output has increased by 140 percent from 1961 to 1999. The vast majority of this increase is as a result of increases in Asia. In Asia we can see almost a 75 percent increase in food production. In contrast, Africa shows a general decline of 10 percent by 1999. The graph also shows that food production is quite variable over time. Most regions except for Asia have experienced periods of increased output and periods of decline. The graph reveals a complex global pattern and this section of the site will look to examine the patterns it shows. Why does food production experience spikes of growth and decline? What has enabled Asia to increase its food production by so much? Why has European food production fallen since the 1980s? In contrast, why has US food production increased over the whole time period? Finally, and very importantly, why has African food production declined over the 40 year period despite independence, development and billions of dollars of multilateral aid support?
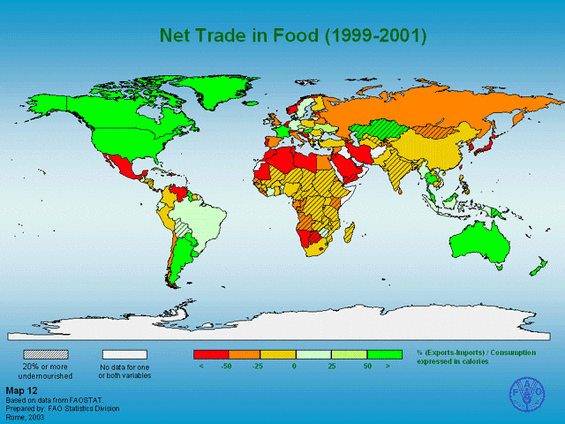
The map to the left shows the net trade in food. There are a number of important points of reference. Firstly, there are only a few net exporters of food; the main countries being USA, Canada, Ukraine, Argentina and Australia, with a number of other S.American and South East Asian economies also net exporters of food. In Europe, only a few countries such as France and Germany are net exporters of food, with many other countries net importers. The most striking pattern in the map is the reliance of the entire African continent on food imports, especially the North African region. The other notable pattern is the reliance both China and India have on food imports despite the scale of their own domestic agricultural output.
The Global Pattern of Food Consumption
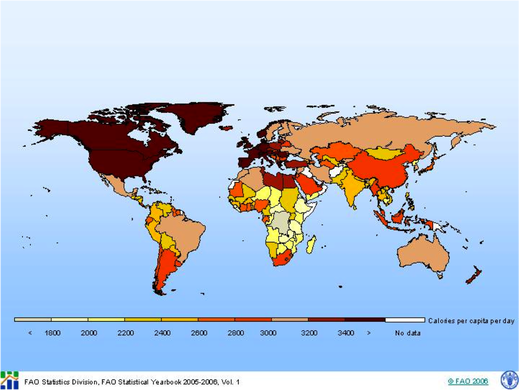
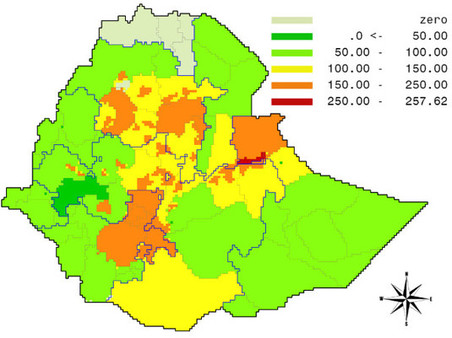
Maps showing world consumption patterns are many and varied. The first graph to the right shows average calorie intake per capita per day in 2005/06. This is a useful map as we can clealy see spatial variation and we can support it with the data. Canada, USA and Europe consume the most calories, with average per capita consumption per day of over 3400. This is more than 40 higher than the recommended daily calorie intake of 2500 for men and 2000 for women. The pattern also shows that in most countries of the world, the average calorie intake is close to or higher than the recommended daily amounts. Sub-Saharan Africa stands out with many countries experiencing below average per capita calorie intake, with DRC experiencing the lowest intake of less than 1800 calories. The scary thing with a chloropleth style map is that it presents country averages and in doing so it hides the extremes within the country. The data hides the dangerously low pattern that reflect hunger and the worryingly high data that might suggest higher prevelance of obesity. The following map shows a slightly different set of data for Ethiopia. It shows the kilocalorie gap that exists within the regions. It shows that in per capita terms, hunger is deepest in Shenile district of Somali Province, in large areas of the Southern Nations and Nationalities Province, and in parts of Amhara, with per capita deficits running between 200 and 257 kcal/day.
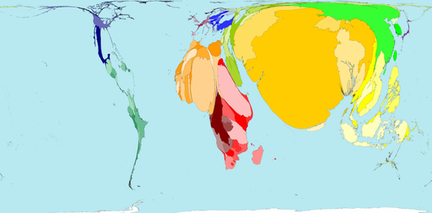
The following map (left) taken from the worldmapper website shows underweight children. The map works by enlarging or shrinking the land space in each country proportional to the extent of hunger experienced in the country. This is a useful classroom resource for starting a discussion. It is also a powerful spatial visualisation of hunger to extract student observation and place knowledge but objectively thinking it's less useful in terms of actual data.
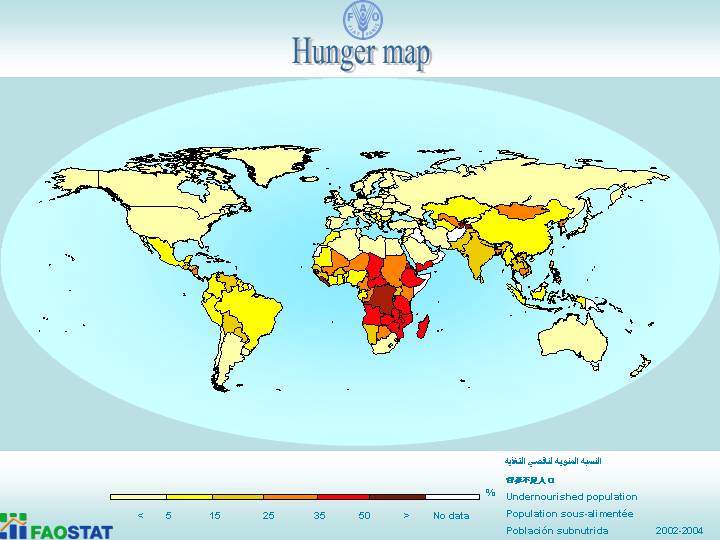
The worldmapper visualisation of underweight children brings the reader's attention to the problem in India. This perhaps distracts the attention away from the problem in Sub-Sharan Africa. The FAO map (above right) on hunger, in contrast, highlights the significant problem in Sub-Sahran Africa, showing hunger prevalance rates of over 35 percent in many countries and for DRC, 50 percent of the population. India appears to have hunger rates of between 15 and 25 pecent. It's not that I want to make light of the issue for India, afterall a 25 percent prevalence amounts to approximately 275 000 people, but rather reflect on how the worldmapper visualisation, sort of distorts the map to create in someways a wrong perspective. Often when students interpret and anlayse patterns in maps like the FAO hunger map, they focus a lot of their attention on the problem regions, in this case Sub-Sahran Africa; neglecting the areas like the US and Europe that have less than 5 percent hunger. In defense of worldmapper it really draws this to the attention of the reader as we can hardly see Europe on the map. Through the use of both maps we can infer a 95% shrinkage in size due to extremely low prevalence of underweight children. I'm not certain whether worldmapper has been used in Post 16 exams yet but I do think it's possible that we will see them. They create the perfect opportunity for students to develop comments that require more synthesis rather than just description.
Food Security and Food Shortage
The UNFAO define food security as ' when all people, at all times, have physical, social and economic access to sufficient, safe and nutritious food to meet their dietary needs and food preferences for an active and healthy life'. Food shortage takes many forms. It can occur acutely over a short period of time or affect people more chronically . There are a number of key terms that describe the type of food shortage. These ara as follows:
Malnutrition is the condition that results from taking an unbalanced diet in which certain nutrients are lacking, in excess, or in the wrong proportion. It develops over the long term. Types of malnutrion include nutrient deficiency (of which there an many types each with their own list of health impacts) and obesity, where by too many high proteins and fats are consumed in the diet. Malnutrition is most found within low income groups. Nutrient deficiency is found mostly in low income countries and obesity if found in high income countries and although obesity is most common among low income groups it is increasingly prevalent across all income groups.
Starvation results from the short term absence of food whilst famine refers to longer term shortages of food, in both cases they can lead to death and are exacerbated by malnutrition.
Food security is effected by many factors, social, economic, political and environmental. We classify the root causes of food insecurity into two broad categories, Food Availability Deficit (FAD) and Food Entitlement Deficit (FED), although it is generally accepted that the causes of food insecurity are complex. In reality some factors act as triggers and others exacerbate the situation. FAD, typically refers to the underlying environmental conditions, such as climate and biosphere. Droughts and desertification lead to crop failure and reduction in crop yield, which have a direct impact on food security. Other FAD factors relate to the remoteness and accessibility of certain regions, problems of supply, transportation and general logistics can lead to the availability of food falling. FED, refers to the more complex, socio-economic and political factors that reduce entitlement to food. This can occur in a region experiencing increases in food production. The cause of this may be as simple as price hikes that take the cost of food beyond people's means. This is common in many places of the world and can be suggested to be the root cause of malnutrition. In more complex socio-political environments, food distribution might be biased to one ethnic group over another or in a strongly patriarchal society, there may be gender bias favouring males over women and girls.
Agricultural Systems
There are many different types of farm. They can be classified as shown below. In reality farms are often a combination of different types of farm, for example, a commercial mixed farm.
1. Commerical Farming - the growing of crops / rearing of livestock to make a profit. Common in most countries
2. Subsistence Farming - where there is just sufficient food produced to provide for the farmer's own family
3. Arable Farming - involves the growing of crops
4. Pastoral Farming - invovles the rearing of livestock
5. Mixed Farming - involves a combination of arable and pastoral farming
5. Intensive Farming - where the farm size is small in comparison with the large amount of labour, and inputs of capital, fertilisers etc. which are required.
6. Extensive Farming - where the size of a farm is very large in comparison to the inputs of money, labour etc.. needed
7. Agribusiness - involves the large corporate organisation of farming- often farms are run for profit maximisation and economy
of scale. Agribusiness often takes over two more stages of the system, e.g inputs and processes
The Farming System
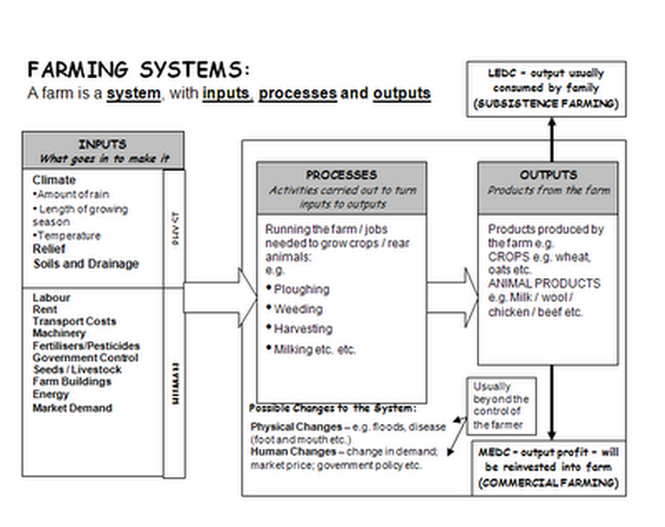
The Agricultural Industry can be explained through a systems approach, with inputs, processes and outputs. The diagram below shows a farming system diagram. Inputs describe what is required to farm. They involve the natural physical inputs into a farm and the human inputs. Generally, the more human (capital) inputs a farm uses, the more intensive it becomes. The larger the farm size in relation to its human inputs, the more extensive it generally becomes. Therefore, extensive farms describe farms that are large in relation to either capital or employment. However, large commercial farms tend to have both large land areas and large capital inputs in the form of mechanisation, irrigation systems, fertilizers and pesticides. In contrast, subsistence farms tend to be small scale, limited in terms of both capital inputs and land area. However, they do require intensive labour inputs due to a lack of available machinery and other capital inputs. This type of small scale farm is common in Sub-Sahran Africa and South and South East Asia. There are other types of subsistence farms that are more extensive. Shifting cultivation is found in the tropical rainforest areas of the world where people engage in a kind of nomadic farming. This shifting cultivation is called slash and burn. In TRF, the soils have little ability to hold nutrients because of the large amounts of rain. The trees and brush are hacked down and burned and these areas are then planted with corn, millet, rice, manioc, yams and sugar cane. Then the field is moved to another area and the plot is allowed to re-vegetate. Nomadic herding is another system of extensive subsistence farming. Momadic herding is the wandering, but controlled movement of livestock, solely dependent on natural forage – it is the most extensive type of land use system. Sheep and goats are the most common with cattle, horses and yaks locally important. The common characteristics are hardiness, mobility and ability to subsist on sparse forage. These animals provide milk, cheese, meat, hair, wool and skins and dung for fuel.
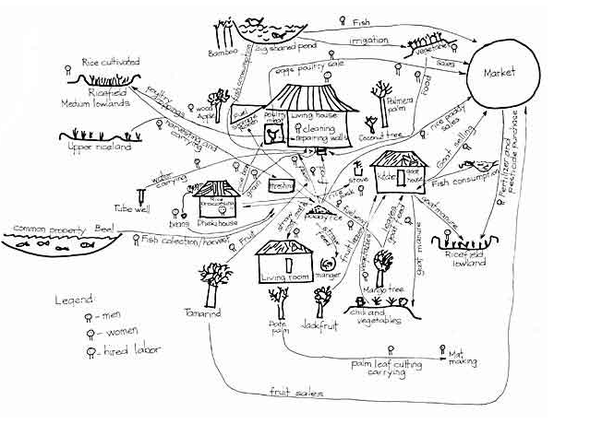
Source: FAO
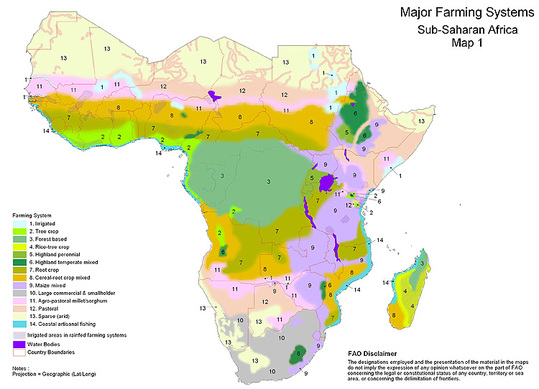
In reality farming systems are far more complex than the above flow chart. They involve a complex web of interactions between the physical environment in all its characteristics and features and the human interactions. This is highlighted from the farmimg system as drawn by the Bangladeshi farmer. In this example, we can see the intimate knowledge of the day to day routines of a labour intensive mixed farm. In this example farm land is not fixed in one place but spread around in different locations, with even specific trees like the Palmera Palm referred to. The reality of the physical environment and availability (or lack of) of capital inputs is also a huge determining factor. The map below of Sub-Saharan Africa shows the variation in farming systems across the continent. The main determining factors
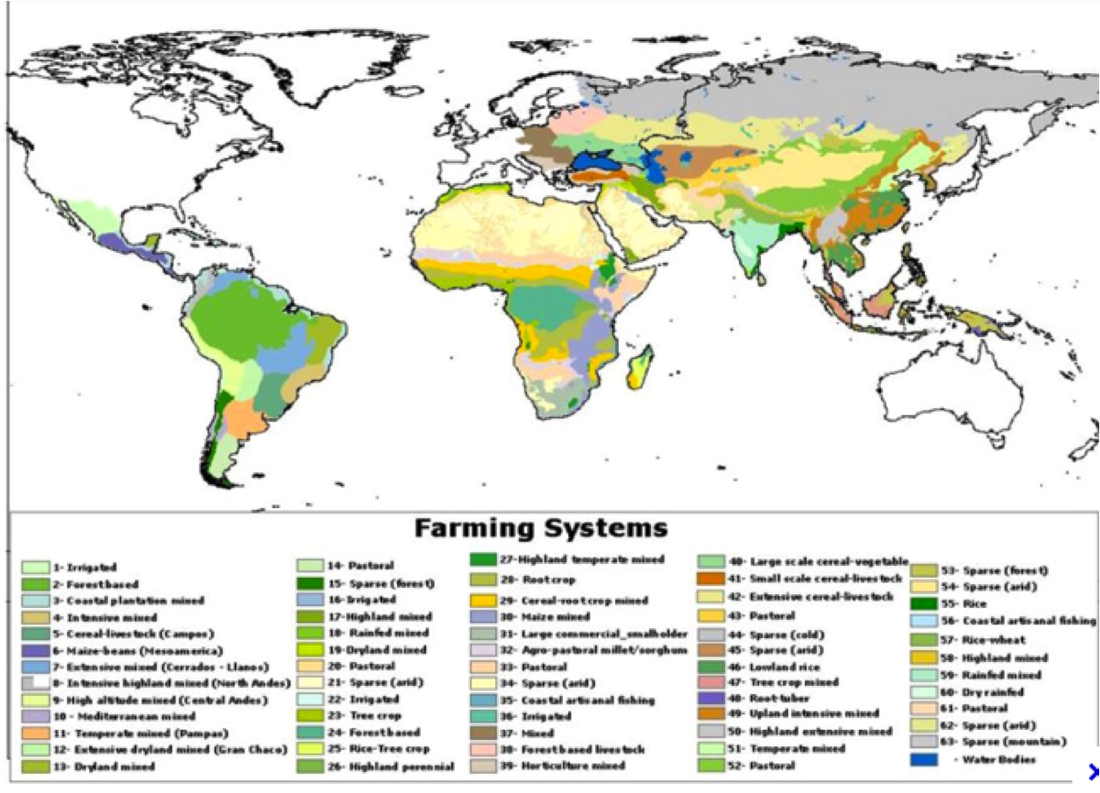
are climate, soil type and vegetation type. The world map shows the farming systems that are found in developing countries.
From this long list of different farming systems a classification of eight broad categories can be used, based on the climate, soils and physical resources available to the farmers, in that region. They are as follows:
- Irrigated farming systems
- Wetland rice based farming systems
- Rainfed farming systems in humid areas of high resource potential
- Rainfed farming systems in steep and high lands
- Rainfed farming systems in dry or cold low potential areas
- Dualistic (Mixed large commercial and small holder) farming systems
- Coastal artisanal fishing
- Urban based farming systems, typically focused on horticulture and livestock production
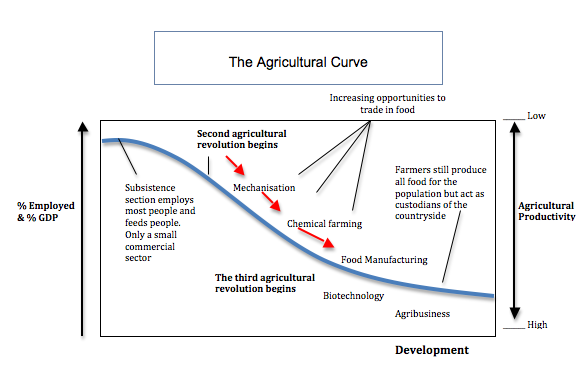
John Dixon's map on farming systems in developing countries shows the importance of the physical environment as a determining factor on the type of farming system that is deployed; it neglects the developed world as these regions of the world have adopted a commercial system that is generally a high intensive capital input system. The world can in fact be spilt into two groups, those that produce food mainly for themselves and those that rely on others to produce their food. This split reflects the divide between subsistence and commercial farming. However in reality, many subsistence farmers are involved in the trade of surplus produce. This can definitely be seen in the Bangladeshi farming system above. Like in other development transitions there is an expected change or continuum from subsistence systems to commercial systems as a country develops. The graph below shows the agricultural curve and shows the changes that take place from subsistence to commercial. To summarise, subsistence farming reflects high employment and low productivity. Subsistence agriculture also represents a high proportion of GDP, although this is not easily valued in subsistence economies. In contrast commercial systems employ fewer people but productivity is higher along with actual food output. To assume however, that the answer to food shortage in regions like Sub-Saharan Africa is a simple switch from subsistence to commercial farming would be naive. The actual reality on the ground is highly complex. Many physical factors and socio-economic factors interact. These include demographics, inheritance laws wage volitility, as well as climate variability and soil degradation and water scarcity. In a time of climate change, competition in arid environments for land and resources is likely to become more fierce.
