|
|
|
Food Security and Strategies to Alleviate Food Shortage.
The FAO estimates that a total of 925 million people were undernourished in 2010, compared with 1023 billion in 2009. That is higher than before the food and economic crisis of 2007-2008 and higher than the number in 1996, the year that leaders at the World Food Summit set a goal of reducing the number of hungry people by half. The graph below shows the number of people hungry globally.
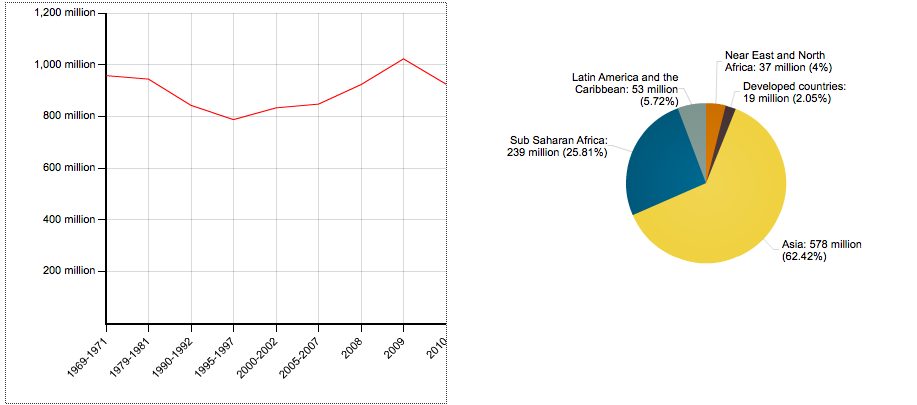
Source: Hungerreport.org
98 percent of these people, live in developing countries with 63 percent in Asia and 25 percent in Sub Saharan Africa. The reason for these worrying rates of increase, despite a concerted global effort to reduce hunger and increased food production over the same time period, owes itself to many factors. Physical factors are often a trigger for acute hunger episodes, like famines but there are long term overarching human factors that effect food price and impact peoples' ability to afford food despite its availability. An important factor driving increased hunger in the world today is to do with the free market. As EU, USA and multlilateral institutions have persued free market conditions to create competition and new markets, developing countries have been opened up to the global food supply. This direct connection with European and American subsidised food supply creates a number of backlashes. Firstly, cheaper food imports undermine local food production and alongside reduced domestic support, local farmers find it difficult to compete on price. This leads to smaller incomes and increased food insecurity. Secondly, global food supplies are volitile to price changes based on global conditions, including oil price as well as commodity trading. This trade in food as a commodity, leaves people more at risk to food shortage as prices increase. Furthermore, the cost of food in family budgets is generally far greater in developing countries than for families in developed countries. Increases in food prices therefore have a more immediate and damaging impact on food security in developing countries. These factors have contributed to an increase in hunger of approximately 14 percent between 1995 to 2009.
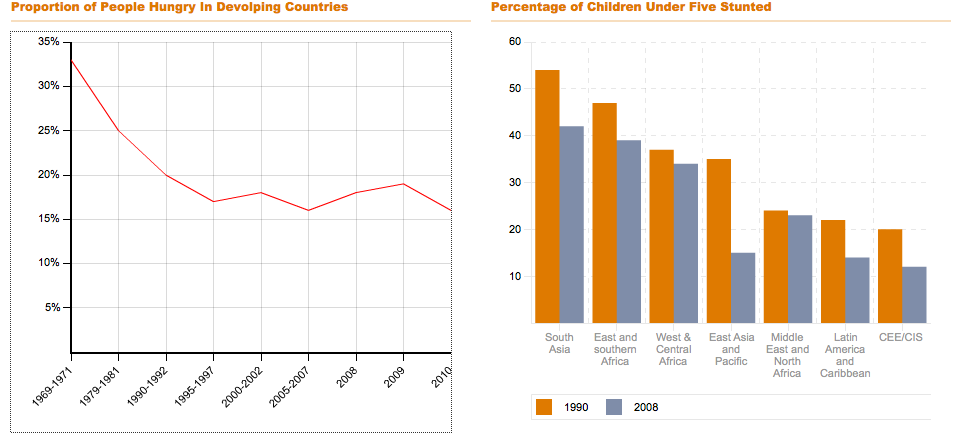
Source: Hungerreport.org
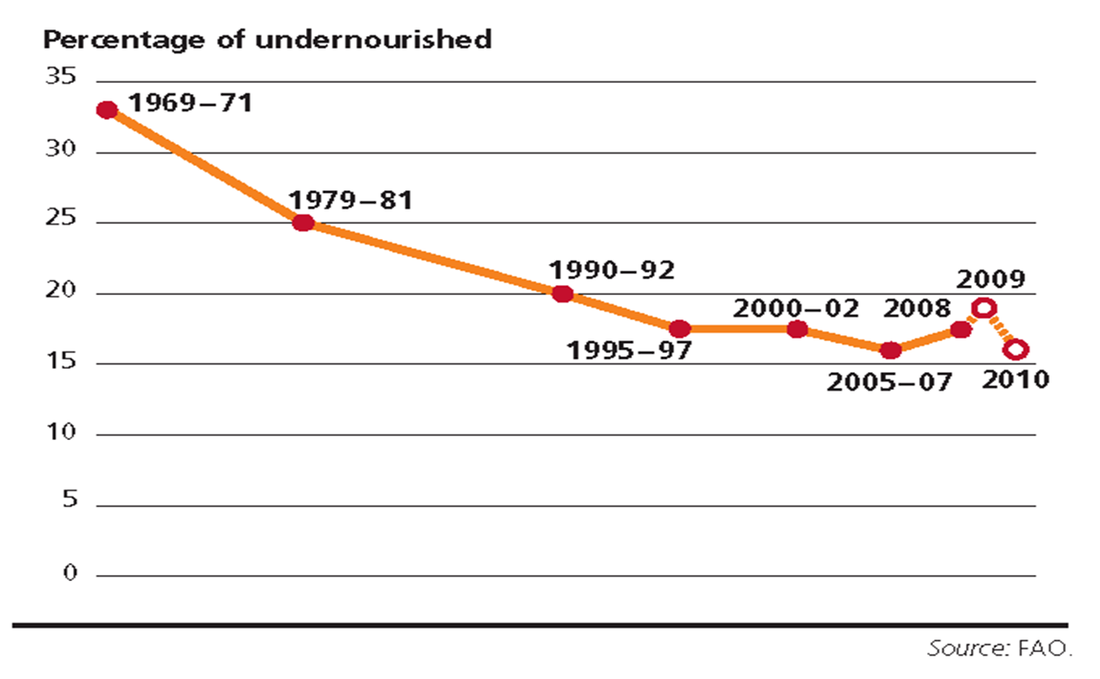
The graph above (left) reflects the counter argument. We can see that the percentage of hungry people living in developing countries has fallen from 33 percent in 1969 to 17 percent in 2010. Effectively this has halfed the percentage. Moreover, if we consider rapid population growth over that same period of time we must recognise that significant achievements have been made. Many commentators would suggest this reflects the success of free market policies. In part this may be true but this success is also a product of improved agricultural productivity, as a result of large scale irrigation schemes and farming inputs associated with the green revolution. We must also examine the timescale of this success. It appears in the graph that very little has been achieved in the last 20 years, with most cuts in hunger made before 1995. In addition, there has only been modest success in reducing stunted growth in children under five years of age between 1990 and 2008. Stunted growth in children is a common characteristics of malnutrition. The factors that explain hunger and malnutrition are complex and vary dependent on the socio-economic, political and environmental conditions of the region. These factors vary over time and space and so it is difficult to generalise for specific countries.
Environmental Factors and Food Security
There are many environmental factors that limit food security. The most obvious is that of water shortage caused by drought. Droughts lead to soil degredation and eventually soil erosion and potentially desertification. This problem effects many places of the world, but is particularly prominent in the Sahel regions of Africa, where population pressure further exacerbates the problem. The Sahel region has over time experienced below average annual rainfalls.
Hier klikken om te bewerken.
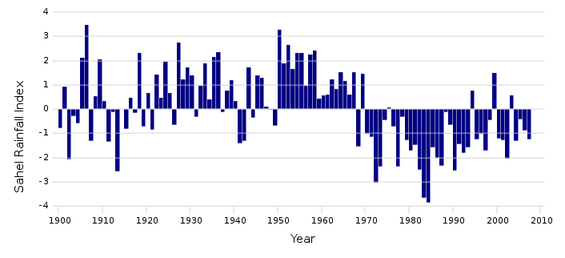
Source: Wikapedia
The graph to the left shows the Sahel Rainfall Index away from a base level average of between 1898 and 1993. It shows an above average period petween 1950 and 1970 and a below average period from 1970 to 1990. Since 1990, rainfall levels have shown a year on year variability and have been just below average. The unpredictability of rainfall in the Sahel places stress on food production and reduces output. The following video shows the impacts of drought on the Sahel. It also introduces the work of the WFP.
Food Insecurity in the Sahel
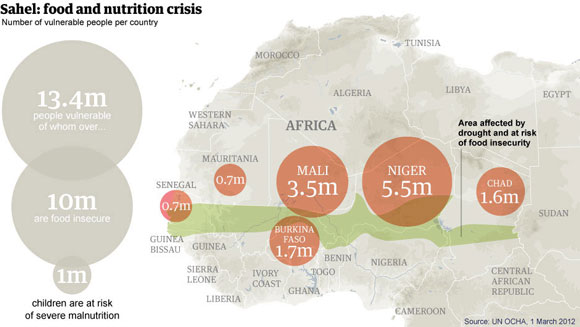
Drought dramatically impacts food production at the local scale and when writing about famine it's important to describe the geographical extent of famine within the region affected. It is unlikley that an entire country will be experiencing famine at the same time. Famine tends to be localised in certain worst hit regions and can cross country borders within those regions. In the video above we hear of an average decline in food production of one third, however for some farmers their loss of production is 100 percent. When families experience fall in food production, they lose out in terms of amount of food they have to eat directly. They also lose the extra food that they might have been able to sell at market in order to supplement their diet with more varied nutrition. The map to the left shows the consequences for food vulnerability, insecurity and severe child malnutrition in the Sahel region.
Other environmental factors include climate change (although human caused). Climate change is compounding environmental problems at the global scale. In some places it reduces the frequency of rainy seasons. India is seeing greater variation in the extent, nature and frequency of the monsoon. Other places are experiencing sea level rise and increased frequency of tropical storms. Sea level rise increases coastal erosion and coastal flooding and it brings with it reduced soil fertility through salinisation. The Pacific region is seeing increased frequency of El Nina and El Nino cyles, which dramatically disturbs the climate patterns of temperature and precipitation in the region, further expanding and contracting food vulnerability over varying spatial and temporal scales.
Other environmental factors include climate change (although human caused). Climate change is compounding environmental problems at the global scale. In some places it reduces the frequency of rainy seasons. India is seeing greater variation in the extent, nature and frequency of the monsoon. Other places are experiencing sea level rise and increased frequency of tropical storms. Sea level rise increases coastal erosion and coastal flooding and it brings with it reduced soil fertility through salinisation. The Pacific region is seeing increased frequency of El Nina and El Nino cyles, which dramatically disturbs the climate patterns of temperature and precipitation in the region, further expanding and contracting food vulnerability over varying spatial and temporal scales.
Demographic Impacts on Food Insecurity
There has always been concerns related to population pressure and food supply. Food insecurity often arises at the regional scale, within fragile climatic zones and impoverished regions of countries. We are seldom concerned with food supply at the global scale. As can be seen in the graphs below, cereal crop production has kept up with population growth since 1950. The majority of this growth is shown to have been achieved in Asia. Asia is also predicted to continue the trend of increased growth in production.

The sources of this increased production has been achieved and is predicted to be achieved from increases in arable land, increases in crop intensity and increases in yield. Globally there will be enough food for a growing world population, but hundreds of millions of people in developing countries will remain hungry and many of the environmental problems caused by agriculture will remain serious, according to the summary report of "World agriculture: towards 2015/2030",published by FAO.

Food production and the Meat Industry
Source: Good Transparancy- Infographic
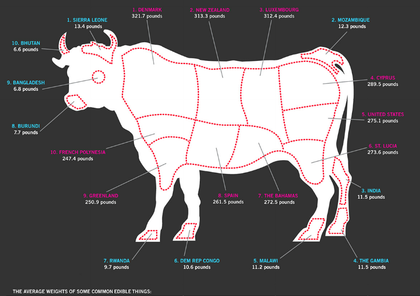
The data shows that food production is increasing over time and that there is more than enough food for the population. However, this food is not evenly distributed. One major problem with food production at the global scale concerns non-human consumption of staple foods. 41 percent of grains are for human consumption, compared to 45 percent for animal feed for the meat industry; meat that then targets high income countries.
Click on the cow to explore the infographic showing the qauntity of meat being consumed in different countries.
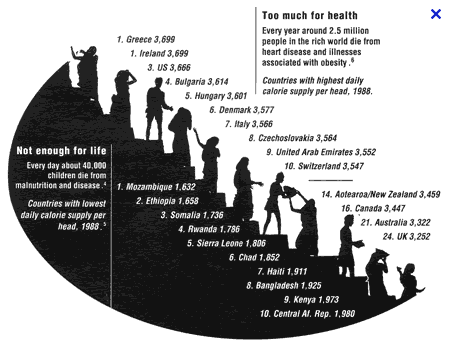
The following picture shows the disproportionate distribution of food in terms of per capita daily calorie intake.
Click on the cow to explore the infographic showing the qauntity of meat being consumed in different countries.
The following picture shows the disproportionate distribution of food in terms of per capita daily calorie intake.
Demographic pressure on food security is more obvious when looking at the balance of resource capacity and population pressure at the national or regional scale. Low income countries are experiencing rapid rates of population growth and will continue to do so for next 40 years. This population pressure is most critical in fragile physical environments, such as glacial fed regions of the Andes, where, recent global warming is causing rapid glacial retreat threatening the existence of many farming communities. Similarly, two billion people who rely on meltwater from the Himalayas, which have lost 21 percent of their glacial mass since 1962 and arid environments will experience water scarcity and food insecurity. In a different way arid environments are equally under pressure through a combination of population pressure and climate stress.
The Threat of Population Growth
Source: Ian MacAuslan
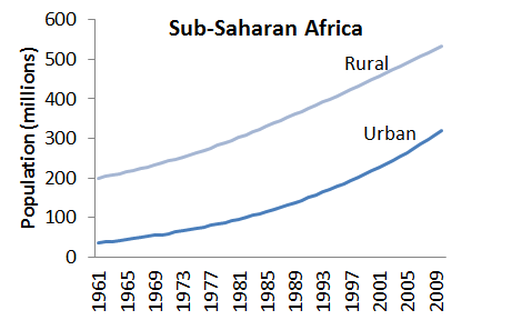
The graph to the left shows the rural and urban population growth for Sub-Saharan Africa between 1961 and 2009. As can be seen in both places population has increased rapidly. Rural population, despite experiencing rapid rates of out-migration have increased by more than 150 percent. Urbanisation over the same time period has caused a six-fold increase in urban populations. The main story here is one of differential rates of growth and this is caused by the migration of people out of rural food insecure regions into urban food secure regions.
Sub-Saharan Africa has one of the world's fastest growing populations (approximately 2.2% a year), and is expected to be home to over a billion people by 2025. In recent years, population growth rates have declined from 2.4 percent in 1997 to an expected rate of less than 2.3 percent today. If we look more specifically at the Sahel region population density, measured by number of inhabitants per sq km, is low. The Gambia has 85 people per sq km, Senegal has 38, Burkina Faso 34, and the remaining four have an average of less than seven people per sq km. This compares to Belgium, which boasts a population density of approximately 359. However, only a small portion of the total land area of the Sahel is suitable for agriculture. The ratio of inhabitants to available agricultural land thus presents a much darker picture than the low population density might suggest. The highest population densities relative to cultivable land are 633 people per sq km in Mauritania, 293 in Mali, and 228 in Burkina Faso. In Senegal the rate is lowest at less than 100 people per sq km.
This scale of population pressure on fragile cultivable land creates enormous stress. Consequently, food insecurity is increased. The main type of farming is mixed and crops consist of staple cereal and roots. This leads to a number of stresses that include, overcultivation as a result of monocultures and overgrazing from livestock. These problems are compounded by inheritance laws that subdivide land amongst sons. In the case of overcultivation, soils become degraded over time as monocultures drain the nutrient base from the soil. This leads to a fall in food production and further environmental problems like desertification and soil erosion. Overgrazing is the result of increased livestock population. Livestock, most typically, cattle and goats remove vegetation cover from soils, which in turn are exposed to the sun and rain. As soils are degraded, farmers are forced to migrate with livestock into more marginal land areas or into regions that bring them into conflict with other farmers. One final population pressure on arid environments is that of deforestation. Deforestation is generally caused by people requiring a source of fuel and although people understand the importance of trees for holding and binding soils, food insecurity often forces people into cutting down trees. During normal conditions people cut wood to sell as fuel in the market. However, during times of drought and food scarcity, trees become a vital source of income and many resort to cuttting trees in order to eat. Farming communities then replenish tree stocks when climate conditions improve. All in all, it's fair to say that through a combination of population and farming pressure as well as climate variability the Sahel and other regions of Sub-Saharan Africa are experiencing increasing rates of food insecurity. This is only likely to increase further in the next 40 years or so.
Political and Economic Impacts on Food Security
It is really important not to generalise political and economic policy and the impacts of these on food security into two camps of high income countries and low income countries. There is much variability among countries and regions and each country will have policies that are suited to their comparative advantage in trade. They therefore respond and experience different impacts in regard to global agricultural trade. Generally, countries can be placed in one of four groups:
- Net food exporters. Food security will not be an issue, but they will be concerned with open access to foreign markets.
- Naturally self-sufficient. At prevailing domestic prices, which should be equivalent to true world prices domestic producers are capable of meeting local food needs at least in normal years. In good years they could export food, or stock food as insurance against a bad year.
- Some countries will not be self-sufficient, but will have export earnings that allow them to meet food import needs, i.e. they are self-reliant. They may be exposed to risk if they are export-dependent on primary commodities. Therefore, it is preferable that export earnings are from a diversified, especially manufacturing, portfolio.
- Some countries will be naturally food insecure and are considered most at risk of food insecurity.
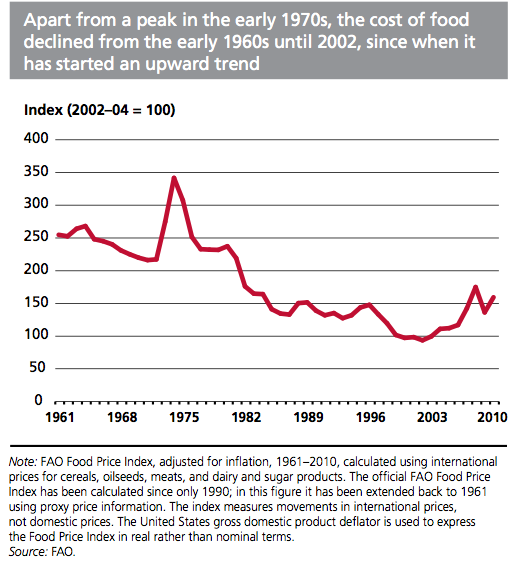
In addition, it must be noted that global economic policy has done much to improve food security in the world. As a result of economic reform, liberalization, and movements toward free trade the world market has seen a massive increase in food production and supply (be it to the advantage of high income countries). The two graphs below show (left) the fall in global food index since 1960 and the fall in hunger (right) of the same time period. There is no doubt that the two graphs mirror each other and represent conditions of improved food security. However, I would like to make two points. Firstly, the pattern of food price decline also respresents a fall in income for small scale famers, which effectively either prices them out of the market or reduces their income to an extent that their food insecurity is impacted. Secondly, between 2003 and 2009, both the food price index and hunger increased. This reflects two things. One, that food prices have become more volitile and are predicted to remain so in the future. Two, that low income countries and therefore the people most vulnerable to hunger are increasingly connected to the global food market and as a result are more subject to its price volitility.
|
|
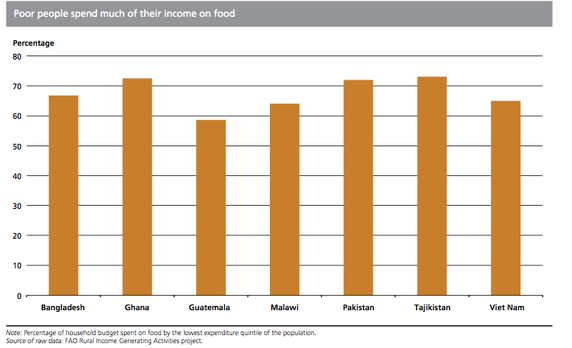
This is further compounded by the percentage of household income spent on food. Households that spend large proportions on their income on staple foods are far more vulnerable to price rises. This can be seen in the graph below.
The Real Cost of Food!
As stated earlier we must remember not to generalise the impacts of political and economic policy on all countries. The conditions and characteristics of each country's trading relationships need to be considered. This can be seen in the graph below, which contrasts African undernourishment with that of Asia's. As we can see Africa experienced increasing undernourishment as a result of rapid increases in food prices. At the same time Asia experienced falling undernourishment and was only marginally affected by the very large price hikes of 2007. These different scenarios reflect very different national contexts.
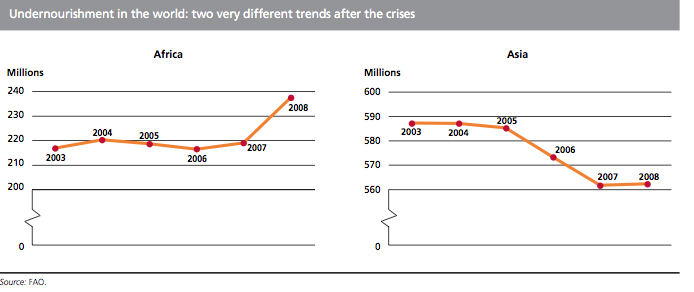
Small import-dependent countries, especially in Africa, were deeply affected by the food and economic crises. Larger (Asian) countries were able to protect themselves more through restrictive trade policies but this trade insulation only served to increase prices and volatility on international markets. Small importing African countries were really badly affected as domestic staple food prices rose substantially in these countries.
Trade policies were an important factor on outcomes – many countries imposed export restrictions or reduced import barriers. In addition to trade policies, releasing public stocks and providing consumer subsidies were among the most common measures adopted as countries attempted to contain the problem of rising prices.
Trade policies were an important factor on outcomes – many countries imposed export restrictions or reduced import barriers. In addition to trade policies, releasing public stocks and providing consumer subsidies were among the most common measures adopted as countries attempted to contain the problem of rising prices.
The Impacts of Food Price Rises
Source: IFAD (below) FAO data
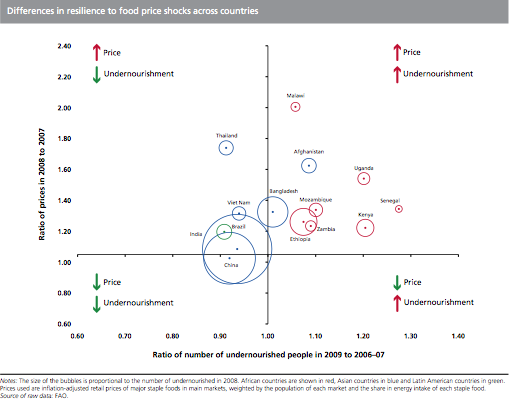
The graph to the left effectively shows three groups of countries. Firstly, countries like Brazil, India and China in the bottom left of the graph were effecively able to protect themselves from the main shock of the price change through restrictive export regulations. In short these countries restricted exports of food and stockpiles supplies for domestic supply. This is costly for the government and reduces export revenue and restricts farmers from benefiting from higher international prices.
Secondly, normal exporting countries like Thailand and Vietnam were really able to take advantage of higher international prices. These countries profited from the price hikes and increased supply to the international market just at the right time. This would have had huge benefits to individual farmers as well as for government revenue.
The third group, located in the top right quarter of the graph were fully exposed to the price rises. According to the report from IFASD and WFP, The State of Fodd Insecurity in the World countries like Burkina Faso, for example, implemented subsidised sales of grain but was forced to rely on WFP to assist 600 000 beneficiaries (through school feeding and mother and child health centres) in 2008. Furthermore they report that the Ethiopian Government sold about 190 000 tonnes of wheat from its grain reserve to about 800 000 urban poor and imported 150 000 tonnes of wheat in August/September 2008 to meet demand in urban areas, while WFP and non-governmental organisations channelled about 200 000 tonnes of food to the increasing number of people requiring food assistance. In the video below, Kostas Stamoulis from the FAO summarises some of the key factors in relation to global trade in food and price volatility.
Food Dumping
It is common for Geography students in assessing the impacts of global trade on low income countries to site the negative impacts of the over supply of subsidised foods, typically from the US and EU into LICs. This often goes by the term 'food dumping'. The general pattern of student response follows the line of food imports undermining domestic food production. Indeed at worst, local markets are undermined through a combination of over supply that lowers price and through undercutting local farmers so that that they cannot compete. The example of wheat export from the EU into North Africa has already been documented at length in the section titled Managing Sustainable Food Supplies. In this example the EU took an aggressive strategy to capture a new market, which effectively undermined local food alternatives. In the worst case scenario food dumping creates food insecurity for local food producers. Farmers experience falling sales and income and therefore struggle to buy sufficient food for their own families. The process creates an urban bias whereby urban dwellers benefit from falling prices and rural farmers suffer from falling incomes.
However, in many cases HIC food exports into LIC markets is a vital support to markets and rather than competing with local production it helps to plug the gap in the market or provide for the shortfall. Often these exports are not competing directly with local food producers but instead provide for greater nutritional diversity.
However, in many cases HIC food exports into LIC markets is a vital support to markets and rather than competing with local production it helps to plug the gap in the market or provide for the shortfall. Often these exports are not competing directly with local food producers but instead provide for greater nutritional diversity.
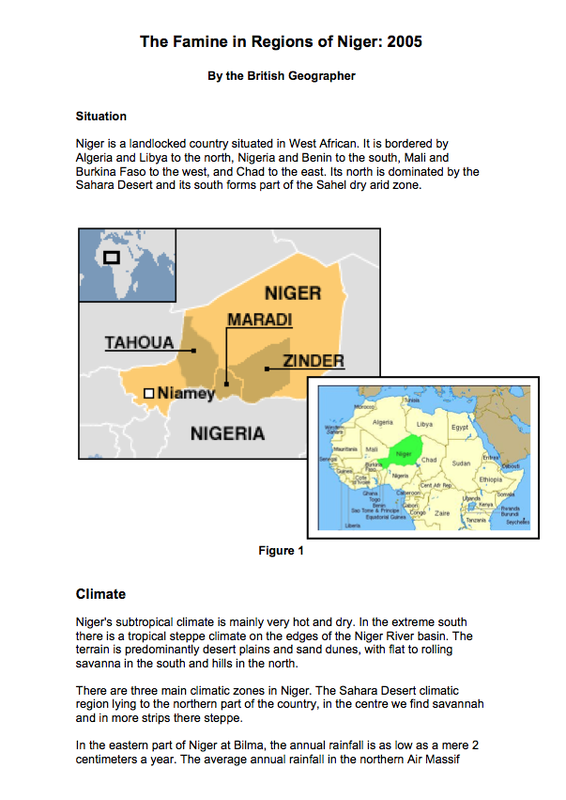
Famine Study: Niger 2005 - Click on the image below to open the PDF
Strategies to alleviate Food Shortage
Land Distribution
In low income countries the central problem is shortage of food and so it is important that the state provides assistance to increase production. In most low income countries a large proportion (the majority) of the population relies upon farming for a living in both subsistence farms and small scale semi-commercial farms. At the same time population size is rapidly increasing and there are few opportunities for employment outside agriculture. Governments therefore have a need to provide farms for landless people. There are two ways in which this can be done. Land Colinization and Land Reform. Land colinization takes place when land that is not used for agriculture is reclaimed and the landless settled upon new farms. Land reform occurs under conditions where much of the land is owned by a small number of rich landlords and farmed in large units. The land is then purchased or expropriated by the state and divided up into smaller farms for the landless.
Land Colonization
The state has readdressed land distribution in many countries in Africa and Asia and Latin America since 1950. In some cases this has been achieved by increasing the amount of land double cropped; but there are sustainability concerns with this. Sometimes it has involved reclaiming poorer land on the edge of villages. But substantial areas have been added by the colonization of sparsely populated waste land or country interiors. Such schemes invariably require the support of the state, due to the cost of bringing poor land into agriculture. Costs include the provision of irrigation and building access roads. There are a variety of reasons for state support of such schemes. In some cases it is to provide a cash crop to export. e.g. the Gezira cotton scheme in the Sudan and in many of the irrigated projects in the savanna interiors of West Africa. Elsewhere the reclamation of new land is for welfare reasons. For example, in India after independence there was a need to provide land for the refugees, and the Indian government continued to try and supply farms for the landless. Between 1947-71 India recolonized vast areas of land for hundreds of thousands of previously landless people. For most low income countries, a fundamental reason for colonization schemes has been to increase food output for a rapidly growing population. Government-sponsored colonization schemes have had an important contribution in Asia. A well documented example is the transmigration scheme of Indonesia. Between 1950 and 1963, 200,000 colonists from Java were settled in Sumatra as part of colonization program to reduce population pressure on Java. In Malaysia over half a million were resettled during the Malayan Emergency (civil war) between 1949–53, and a further 20,000 in more peaceful conditions, 1956–64. By far the largest schemes have been in India where, from independence to 1971, 600,000 ha were brought into cultivation, providing homes for 800,000 people. Some have argued that the extension of the cultivated area is too expensive, and that money would be better spent supporting the more intensive farming of existing cropland. But this of course neglects the welfare aims of colonization schemes. In Indonesia there have been many concerns regarding the land rights of indigenous populations, Land colonization has directly impacted the way of life of indigenous people and has taken the forest resource that they live on. There have been many cultural diaspora problems as well.
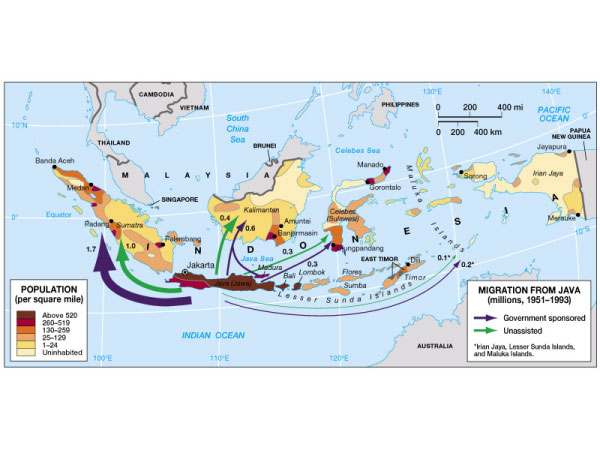
Transmigration from Java 1951-1993
Land Reform
Immediately after the Second World War, it was thought by many that a better standard of living and higher productivity in agriculture were only possible if land reform was carried out. In general there was the feeling of injustice over an unequal distribution of land ownership in many countries. In many Latin American states for example, much of the land was - and still is concentrated in a small number of large estates, while the bulk of the rural population made do with very small land plots or none at all. Even where land ownership was not so inequably distributed, it was argued that tenancy (when a farmer has to rent land) was unjust, and that farmers who owned their land would be more productive. As a result the second part of the twentieth century saw wholesale changes in land ownership in low income countries. Some of the most impressive results of land reform can be seen in Taiwan. Reform began with Acts in 1951 that provided the tenant with security and controlled rents. In 1953 the government compulsorily purchased private land in holdings above 6 ha of wet-rice land and 12 ha of dry land, and provided purchasers with comfortable credit terms. As a result the proportion of farm land cultivated by owner-occupiers rose from 56 per cent of the total in 1948 to 86 per cent in 1959. Taiwan has achieved a remarkable rate of productivity increase in agriculture since the Land Reform.
Land Reform in Zimbabwe
A more recent case of land reform has been well documented from Zimbabwe. Over the last 30 years land has been removed (sometimes violently since 2000) from around 4000 white landowners to approximately 1 million black farmers. From a 10 year study of 400 households led by Ian Coones at the UK's Institute of Development Studies at Sussex University, it was found that about two-thirds of people given land in Masvingo were "ordinary" - low-income - Zimbabweans. The remaining one-third included civil servants (16.5%), former workers on white-owned farms (6.7%), business people (4.8%) and members of the security services (3.7%). On average, each household had invested more than $2,000 (£1,200) on their land since they had settled on it - clearing land, building houses and digging wells. This investment has led to knock-on activity in the surrounding areas, boosting the rural economy and providing further employment. However, most beneficiaries complained about the government not giving them the support they needed, such as seeds, fertiliser and ploughing the land. It is often argued that large-scale commercial farming - as many of the white Zimbabweans used to practise - is inherently more efficient than the smallholder system which replaced it, but Ian Scoones dismisses this argument. He says it is now impossible to return to the previous set-up and even suggests that some of the evicted white farmers may one day work with the new farmers as consultants, marketing men, farm managers or elsewhere in the overall agricultural economy, such as transporting goods to market or helping to transform and add value to their produce.
Increasing Yield Through Sustainable Farming
Sustainable farming or organic farming is not just a niche market in high income countries, there is a real need for its broad development in low income countries. Sustainable farming puts the evironmental resources of soil, water and trees first and it has a strong emphasis on social welfare, which effectively means increasing income and food supply to poor farmers. Sustainable farming falls under the broader classifcation of permaculture. Permaculture is defined as a branch of ecological design that develops sustainable human settlements and self-maintained agricultural systems modelled from natural ecosystems. For poor farmers to make the switch to permaculture or organic farming they need state support. This support can be provided in education and training and improved access to information on markets. This involves better communication, achieved through mobile phone networks, better transport and storage facilities. Alongside this farmers need better access to affordable credit so that they have the means to invest their own money. In addition there are many positive environmental and socio-economic services of organic farming.
The following video produced by Farmingfirst.org shows the importance of increasing farming yields through sustainable means as well as the political support mechanisms required.
The following video produced by Farmingfirst.org shows the importance of increasing farming yields through sustainable means as well as the political support mechanisms required.
Food Aid
Types of Food aid, Benefactors, Beneficaries, 2008
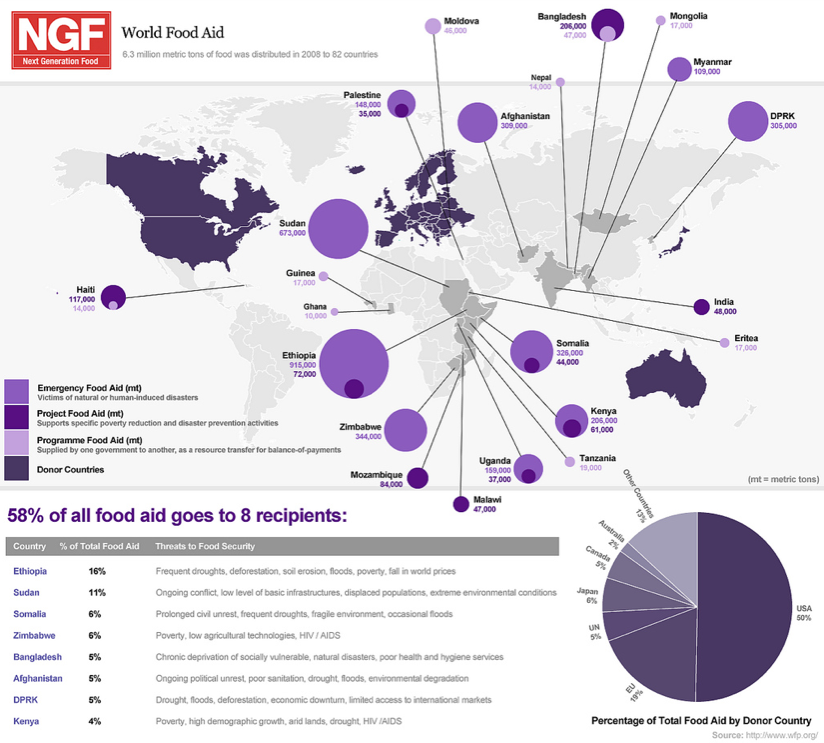
There are three main types food aid, each type with its own purpose and structure of exchange. The graphic to the left shows the type and movement of food aid from the main donar regions of North America, Europe, Australia and Japan to aid recipients to regions of West Africa and South Asia as well as several other countries like Afghanstan and Mongolia. The size of the circle is proportionate to the quantity of aid being received. Therfore the largerst recipients of aid in 2008 were Ethiopia (16%), Sudan (11%) and Somalia (6) and Zimbabwe (6%). The US were by far the biggest donors providing 50 percent of all food aid. The EU were second providing just short of 20 percent. We can also see that the vast majority of food aid is received in the form of emergency food aid. Emergency food aid as the name suggests is supposed to be provided during times of acute food scarcity. The emergency food aid bridges the supply gap and saves lives. A much smaller amount of food aid comes in the form of project aid and programme aid. Project aid is targeted aid for specific poverty reduction measures. An example of project aid is Food For Schools, whereby children receive a nutritious meal at school. In this way nutrition needs are met and school enrolement is increased. Another example might be maternal health to provide a better balanced diet to pregnant women. Programme aid is bilateral aid, which helps provide for increased food supply to a country. It is largely used as a resource transfer for balance of payments. The receipient country benefits from cheap, but generally nutritious-poor monculture food. The donor country benefits from the distribution of subsidised food from its domestic industry.
The global pattern of food aid has changed. Between 1996/98 and 2006/08, the share of emergency aid rose from 38 percent to 66 percent of all food aid whilst programme aid shrank from 33 percent to 12 percent. Project aid also declined over the decade, from 28 percent to 22 percent as has monetization, which is the agreed sale of food under favourable conditions to co-operative sponsors such as US NGOs and governments. The last activity remains an important component of US food aid policy and of some US NGO programmes. Some NGOs, notably CARE, have been recently phasing out monetization on grounds of efficiency and effectiveness. An increasing trend for many donors except for the USA is to switch to local and regional procurement of aid; this may involve cash injections so that local economic gains are made and efficiency and effectiveness cuts logistical cuts and speeds up times of delivery.
The global pattern of food aid has changed. Between 1996/98 and 2006/08, the share of emergency aid rose from 38 percent to 66 percent of all food aid whilst programme aid shrank from 33 percent to 12 percent. Project aid also declined over the decade, from 28 percent to 22 percent as has monetization, which is the agreed sale of food under favourable conditions to co-operative sponsors such as US NGOs and governments. The last activity remains an important component of US food aid policy and of some US NGO programmes. Some NGOs, notably CARE, have been recently phasing out monetization on grounds of efficiency and effectiveness. An increasing trend for many donors except for the USA is to switch to local and regional procurement of aid; this may involve cash injections so that local economic gains are made and efficiency and effectiveness cuts logistical cuts and speeds up times of delivery.
Food Aid: a small fraction of Development Aid
As you can see from the graph to the right total development assistance from 1965 to 2005 has increased dramatically from around $32 billion to over $100 billion. These figures are total annual spends. The financial input is massive. Development assistance is a broad term and refers to all types of capital investments, both bilateral and multilateral. Foreign aid is just a part of its sum and food aid represents approximately 25 percent of foreign aid. Given the vast scale of development assistance since 1965 one might question in reality what it has achieved. The findings do not make for great reading, particularly when we turn the focus on Sub-Saharan Africa, for which many of the development indicators show a backward trend rather than one of development. Something therefore is wrong with the way development assistance targets the poor. In regard to food aid the criticism falls on the quality of food aid. Within the debate on food quality even the school feeding programs of the World Food Program are called into question. The general critique suggests that food aid is low quality and low in nutritional value. There is a need to improve the nutritional value of food to tackle the chronic problems of malnutrition. In essence the type of food, like wheat and maize is simply a stomach fill. In the short term, a child's hunger is satisfied but yet in the long term nothing is achieved in providing for certain nutrient deficiencies. The child, therefore remains undernourished and vulnerable to sickness and rapid decline during periods of acute food shortage. The following video features an interesting debate on the quality of food coming out of the US. It also discusses some of the domestic reasons from the USA continuing with the status quo.
Changes in the Nature of Food Aid
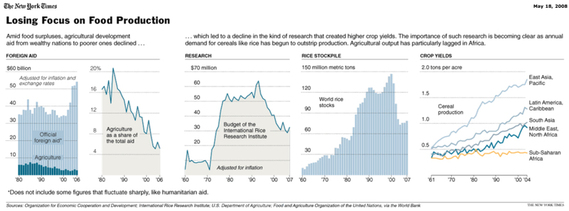
The graph to the left titled Losing Focus on Food Production compiled by the New York Times shows falling agricultural aid as a percentage of total foreign aid. It also shows how cereal production has increased. In addition, we can see that research funding; partly responsible for many of the past achievements in increased food production is falling. The article discusses the problems of cutting back on research as demand for food potentially catches up on supply. It also refers to the fall in aid to poorer countries. It is true that traditional food aid in the form of emergency and programme aid is being cut back. The EU has moved largely away from programme aid toward rural development and capacity building. Food aid has fallen from 20 percent of global development assistance to just over 6 percents in the last 30 years as western governments realise that there are more effective ways of improving food security.
Food Security
Food security refers to the long term availability and access to nutritious rich food and stable supply of food. There remain enormous challenges to achieve it at the global and regional scale but it is important that countries are realising that they need to tackle food security in the long term rather than food shortage in the short term. The following videos show some of the discussion and thinking coming out of the EU. In particular the UN Special Representative David Nabarro in the second video speaks frankly about the precise steps that need to be taken to achieve global food security.
|
|
|
