|
|
|
Patterns of Health.
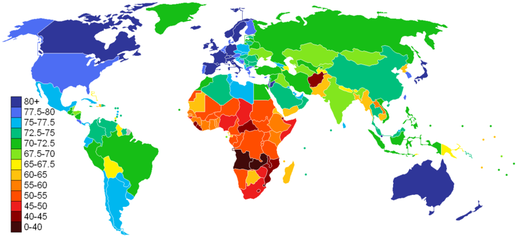
Life Expectancy 2011
Source: CIA Factbook
An important indicator of health is life expectancy from birth. Life expectancy for a country varies based on your year of birth and on close inspection within countries in terms of income and ethnic group. In general life expectancy shows the average expected length of life for a country and therefore represents a fairly broad and useful indicator in regard to the state of health in a country. As we can see from the world map, life expectancy varies considerably on the spatial scale. You can expect to live into your 80s in Australia, Canada and may countries of West and North Europe, and over 75 years in most other high income countries including the USA and Mexico. In fact in most regions of the world we can see that you can expect to live over 65 years except in Sub-Saharan Africa and Afghanistan. The three countries with lowest life expectancy in the world are Mozambique, Swaziland and Zambia, with life expectancy of 39.2, 39.6 and 42.4 respectively. However it has not always been this way. In the early 19th century nearly all countries had life expectancy like Mozambique today, but due to improvements in health, food supply and wealth life expectancy has improved in all countries. The following graphs show the global and regional trends for the last 50 or so years.
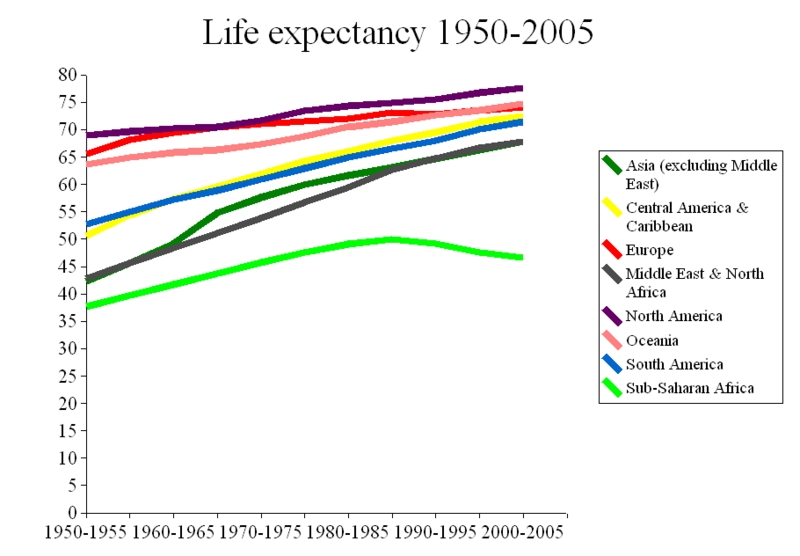
Source: wri.org
|
|
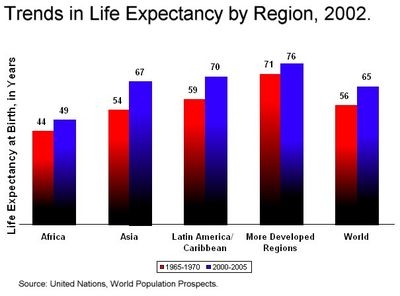
In many ways the graphs show an increasingly flatter world. In 1950 there were clearly two groups of regions. North America, Europe and Oceania with high life expectancy and South America, Central America & Caribean, Middle East and Africa and Asia all with low life expectancy below 55. Sub-Sahran Africa has the lowest life expectancy below 40. All regions have experienced an increase in life expectancy over the last 50-60 years. World life expectancy since 1965 has increased from 56 to 65 and regions with the highest increases in life expectancy is Asia, which increased its life expectancy by 26 percent from 54 to 67 by 2005. The change in life expectancy is wonderfully visualised in the following gapminder video by Hans Rosling. It shows that most of the regions of the world have now caught up those 1950 life extpectancy levels of North America, Europe and Oceania.
We need to be a little more careful in regard to explaining this pattern of change. Firstly, there are two clear trends to be aware of. The first is that all regions of the world except for Sub-Saharan Africa have seen significant growth in life expectancy. The second is partly stated already is that Sub-Saharan Africa has been left behind. The IB refers to the importance of income and lifestyle in explaining this pattern. With income it is relatively easy to recognise how it links to health. Income has a direct impact on the conditions in which a household or country finds itself. Lifestyle is defined as a way of life or style of living that reflects the attitudes and values of a person or group and in this regard its reflects choices. These choices are of course influenced by the conditions of the place in which you live and so vary both within countries and between countries. Lifestyle is intrinsically linked to culture and society. The factors of income and lifestyle will be developed further in the section on disease of affluence and poverty.
Indicators of Health
Health can be measured through a number of different indicators. The IB Geography specification refers specifically to the need to evaluate life expectancy, infant mortality rate (IMR) and child mortality, Health-Adjusted Life Expectancy (HALE), calorie intake, access to safe water and access to health services.
Average Life Expectancy
Average life expectancy is a good indicator of health as it informs us generally at the national scale the length of life a person can expect to live. Of course this is impacted by extreme events in some places such as conflict but generally natural disasters and conflict are not significant enough to have any significant impact on life expectancy. Therefore life expectancy is a strong indicator of health and health services in a country. It is useful to use average life expectancy to compare places at the national scale. However it isn't always representative of different regions or groups within a country. When used to compare countries average life expectancy hides variations that may exist within different socio-economic groups and spatial variations such as rural and urban or based on Political Geography. However, in countries where data is more readily available (and that's most) average life expectancy can be presented to compare different political regions.
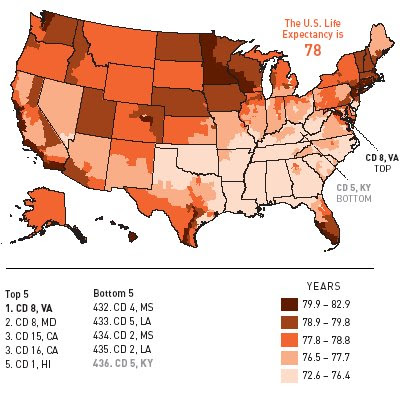
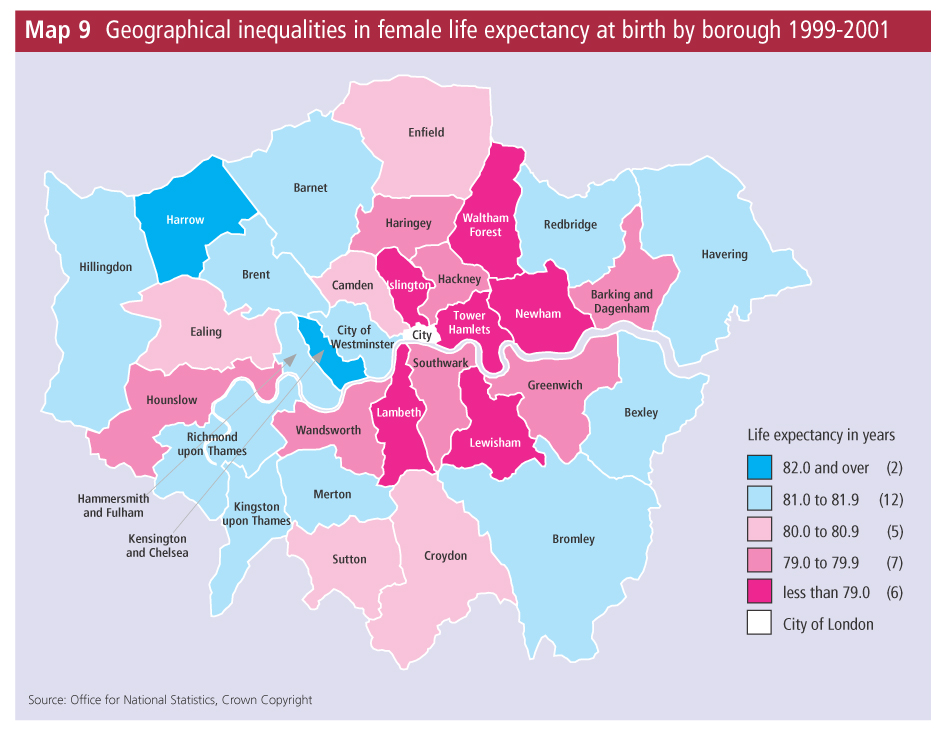
|
|
In the two maps above showing the USA and Greater London we can see that there is spatial variation within both countries and cities and this likely to reflect socio-economic characteristics of the places. From the USA map we can see that life expectancy is lowest, between 72.6 and 76.4 in the Sourthern states of Oklahoma, Arkansas, Louisiana, Mississippi, Alabama Tennessee and Georgia. There also appears to be distinct variations within states, for example the south of Texas shows a south to north continuum with some of the highest life expectancy (in the country) found in the south but the lowest life extpectancy in the north. In London we can see that variations exists within the city. Harrow in the north and Kensington and Chlesea in the cetnre show a life expectancy greater than 82 whilst six authorities coloured bright pink have life expectancy at least three years lower under 79. As you can see when life expectancy is presented in this way it is a rather effective health indicator but all too often when used to compare at the national scale the spatial variation is ignored. Finally, it is important to consider how life expectancy varies among socio-economic groups.
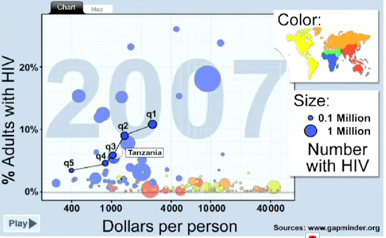
HIV prevalence by income quintile in Tamzania
Source: Gapminder
|
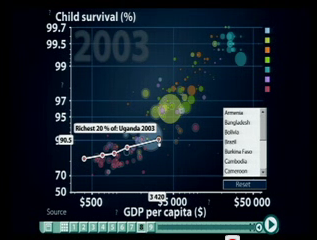
Child survival and GDP per cpita shown in income quintiles for Uganda
Source: Gapminder
|
The two graphs above produced by the outstanding website gapminder show an incredible variation within the income quintiles of Tanzania (left) and Uganda (right) 6 percent of Tanzania's adult population are HIV positive but when broken down into income groups the surprising data reveals that prevalence rates with Tanzania are highest (11%) amongst its 20 percent richest an lowest (4%) among its 20 percent poorest. In Uganda we see the same income quintiles but in regard to child survival we see the richest 20 percent of the poulation have a 90.5 percent child survival rate whilst the poorest 20 percent of the population have a child survival rate of just 82.8 percent. Although these two indicators don't show life expectancy itself you must recognise that both HIV prevalence and child survival impact average life expectancy and we would see the same variation within income groups for average life expectancy. These two other health indicators also reveal a final criticism of life expectancy as an indicator of health. On its own average life expectancy fails to identify any specific health weaknesses. For example it doesn't tell us anything about maternal or infant health or health care and therefore tells us very little about the precise problems related to health of the population or shorfalls in health services.
Infant Mortality Rate and Child Mortality Rate
IMR refers to the number of deaths of babies under one year of age per 1000 live births in a year. Child mortality rate refers to the number of deaths of children aged 1-5 per 1000 of the population per year. We must be careful to distinguish child mortality rate from child mortality, which includes all childeren 0-5. Both indicators are useful for measuring health and health care in a country or region as they highlight a vulnerable age specific period. Children under the age of 5 are considered most vulnerable to health problems and so the indicator is considered to be representative They not only inform us about the quality of health of infants and children but they are also offer an important indicator for maternal care as well. Similar to life expectancy infant and child mortality can be used to measure health at a variety of scales but most typically these indicators are used as average rates to compare health care of infants and children among different countries. It is often difficult to find the data to help us distinguish between regions with in countries and socio-economic groups.
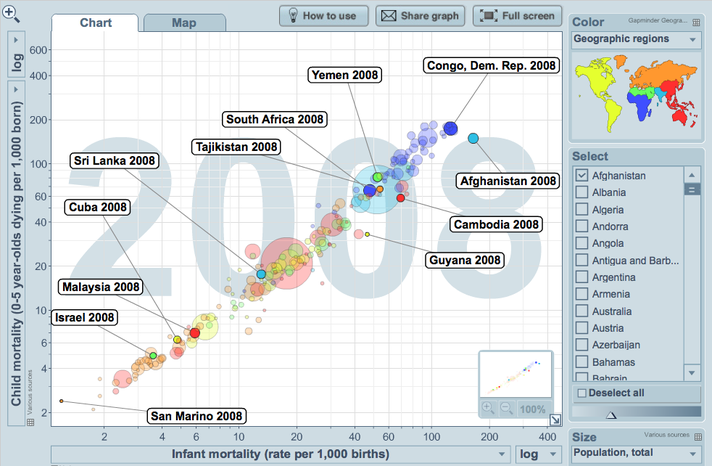
Source: Gapminder World
The graph above made using Gapminder World shows all country's pattern of infant mortality rate (deaths under 1) and child mortality (deaths 0-5). As you would expect, as the latter indicator partly includes the first there is a positive relationship within the data set. The bubbles represent countries, the size represent population and the colour represents the geographical region. The countries highlighted show the range in mortality data for the given geographical regions. As one might expect the Eurasian region boasts the largest range with most European countries clustered the bottom left of the graph showing low child and infant mortality, with central countries like Tajikistan extending the range. In addition, it is intersting to obeserve the socialist state of Cuba, which boasts the best health of all of the Americas and is significantly better than the USA. There is a very big range in North Africa and the Middle East, with poor Yemen struggling with approximately 80 children dying in their first 5 years, 50 of which die in their first 12 months. This compares to Israel, where only 5 children die between 0-5 years and 3.5 of these in their first 12 months. The region with the smallest range ignoring some of the West African island economies is Sub-Saharan Africa. The Continental countries all have high child and infant mortality, with nearly all countries suffering between 60 and (nearly) 200 child deaths out of ervery 1000 per year. Between 50 and 150 of these die in their first 12 months.
It's difficult to find critiicism with this type of health indicator when presented and visuulaised in this way. The only concern I have is to comment on how representative it is considering the geographical regions of a country and socio-economic groups. In most countries health care provision is not evenly distributed in a country and certainly in Sub-Saharan Africa there exists an urban bias that causes rural health poverty. The data for both child mortality rate and infant mortality rate when shown as an average fails to reveal this. This issue can be illustrated using an image taken from Human Development Trends, again from the Gapminder.
It's difficult to find critiicism with this type of health indicator when presented and visuulaised in this way. The only concern I have is to comment on how representative it is considering the geographical regions of a country and socio-economic groups. In most countries health care provision is not evenly distributed in a country and certainly in Sub-Saharan Africa there exists an urban bias that causes rural health poverty. The data for both child mortality rate and infant mortality rate when shown as an average fails to reveal this. This issue can be illustrated using an image taken from Human Development Trends, again from the Gapminder.
Varitions Within Countries
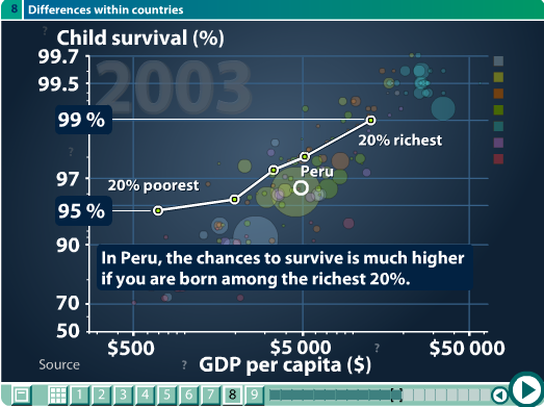
Source: Gapminder
Firstly, it is important to note that the indicators in this second graph have changed. On the Y-axis we can see child survival presented as a percentage of children surviving to the fifth birthday. As this is a percentage it represents every 100 births. On the X-axis we can see GDP per capita. The graph illustrates in the horizontal range the the range the GDP shown in quintile groups. The richest 20 percent in Peru have a similar wealth to Hungary. The poorest 20 percent have a similar wealth to Eritrea. The vertical range represents the health differences. Within these socio-economic groups we can see that 4 more children per 100 survive in the richest 30 percent compared to the poorest 20 percent.
Health Adjusted Life Expectancy (HALE)
HALE is a broader indicator of the overall health of a population as it combines both age and gender specific health data and mortality data into one data set. As a result HALE indicates the number of expected years of life that one would expect to live in full health, based on the average experience of the poulation. It therefore uses both life expectancy and the quality of that life. In doing this it shows a broader representation of health than average life expectancy and a broader insight to overall quality of health over a life time compared to the age specific indicators of child and infant mortality.
HALE is calculated through a combination of life expectancy tables and Sullivan's method, which looks at the number of years at a particular age, an individual can expect to live in a healthy state. The calculation weights each type of disability in regard to its severity. This data is readily available from death registers, census sources and available child and adult mortality data sets. However, the main concern with this indicator is in regard to quality of data available. There are limitations in regard to reliability of data, especially from low-income countries. There is also the problem concerning the lack of comparability of self-reported data from health interviews.
HALE is calculated through a combination of life expectancy tables and Sullivan's method, which looks at the number of years at a particular age, an individual can expect to live in a healthy state. The calculation weights each type of disability in regard to its severity. This data is readily available from death registers, census sources and available child and adult mortality data sets. However, the main concern with this indicator is in regard to quality of data available. There are limitations in regard to reliability of data, especially from low-income countries. There is also the problem concerning the lack of comparability of self-reported data from health interviews.
Healthy Life Years at Birth

Source: European Commission
The graph above shows data very Similar to HALE and is called Healthy Life Years. It shows the expected number of healthy years a person can expect to live when born in 2004 and and 2010 for European countries. As you can see the data set is not so full for 2004. Unfortunately the screen shot for this graph makes it difficult for you to identify specific countries. The image is hyperlinked to the website and you find the data by pressing Choose YOUR INDICATOR and then Health Status Indicators.
In the graphic above we can see that the number of expected healthy years has increased for childern born in 2010 compared to 2004. If we look at the orange bar at the bottom, which represents Sweden we can see that in 2004 it trailed several European countries with a expected healthy life expectancy of 62. However, by 2010 healthy life expectancy had increased to 72. A number of points can be raised here. Firstly, I don't doubt that Sweden might lead the table in Europe as it boasts incredible social welfare and health services and there is of course something beautifully healthy about the Swedes! My second point though, raises the question of the quality of the data feeding into this indicator. I would suggest with some confidence that the expected healthy life of a child born in 2004 compared to 2010 does not differ by 10 years. I would also suggest that the data set for 2004 was poor and that over time the data will become more realistic as more reliable and comparable data feeds in.
In the graphic above we can see that the number of expected healthy years has increased for childern born in 2010 compared to 2004. If we look at the orange bar at the bottom, which represents Sweden we can see that in 2004 it trailed several European countries with a expected healthy life expectancy of 62. However, by 2010 healthy life expectancy had increased to 72. A number of points can be raised here. Firstly, I don't doubt that Sweden might lead the table in Europe as it boasts incredible social welfare and health services and there is of course something beautifully healthy about the Swedes! My second point though, raises the question of the quality of the data feeding into this indicator. I would suggest with some confidence that the expected healthy life of a child born in 2004 compared to 2010 does not differ by 10 years. I would also suggest that the data set for 2004 was poor and that over time the data will become more realistic as more reliable and comparable data feeds in.
Calorie Intake
Calorie intake measures the daily consumption of food in calories compared with the recomended daily consumption, which is 1940 calories per day for women and 2550 for men. The map below shows how daily calorie intake varies between countries, with the minimum daily calorie consumption just over 1500 found in countries like Afghanistan and DR Congo and the highest over 3500 in countries like Canada, Italy, Greece , Germany and France. The highest daily calorie consumer is USA with over 3770.
The map below is an outstanding infographic which brings up data on each country as you move the mouse over it. The striking thing with this data shows us that most countries have experienced increasing daily calorie consumption since 1990 except for some coutries in Sub-Sahran Africa that have experienced falling daily calorie consumption.
The map below is an outstanding infographic which brings up data on each country as you move the mouse over it. The striking thing with this data shows us that most countries have experienced increasing daily calorie consumption since 1990 except for some coutries in Sub-Sahran Africa that have experienced falling daily calorie consumption.
via chartsbin.com
|
via chartsbin.com |
The main problem with calorie intake except in addition to the ongoing critique apparent in all the indicators of averaging out disparities within countries, is in relation to what calorie intake actually is. A calorie is actually a unit of heat energy. The body sees calory intake as energy and it's energy to produce heat. Different foods have different amounts of calories. Calories are provided by fat, carbohydrate, and protein. Fats have the highest concentration of calories, nine calories per gram of pure fat. Protein and carbohydrates each have four calories per gram of
|
pure protein or pure carbohydrate. What is important to a healthy body and mind does not just concern the quantity of calories being consumed but rather the balance of nutrients in the diet. In the infographic above and below we can see that intake of protein and carbonhydrates respectively vary enormously with wealth. The US daily protein consumption is highest at 114g/person/day, the lowest is DR Congo at a mere 25g/person/day. The contrast in carbonhydrate consumption is also stark. There is clear evidence of reliance on moncultures, like maize and rice in countries like DR Congo and Bangladesh where 80 percent of the diets are made up of carbonhydrate; this compares to the lowest in Spain of just 45 percent carbonhydrates. Nutrient balance is an important factor missing in daily calore consumption as an indicator of health. It informs on the quantity of food being consumed but it tells us nothing about whether this food has the right nutrient balance to prevent nutrient deficiency illnesses and maltnutrition. Furthermore, malnutrition increases a person's vulnerability and exposure to other infectious diseases like malaria and TB. A final criticism of daily calore intake is based on the the standardisation of it for men and women. It is well known that men and women of different size, occupation and place of origin require very different levels of daily calorie intake. It is impossible that there is a one-size-fits-all and so making direct comparisons between countries is not always reliable or relevant
via chartsbin.com
Acess to Clean Water
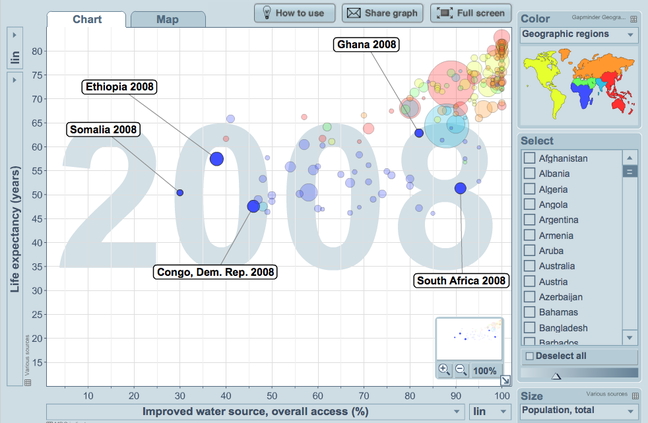
Source: Gapminder World
Access to clean water refers to both clean drinking water and sanitation.
Safe drinking varies emormously within and betwen countries. The graph to the left shows the full range at the global scale from a whole string of countries that offer 100 percent access to clean drinking water to Somalia that only provides 30 percent of its population with clean drinking water.
The graph provides compelling evidence that the provision of comprehensive access to clean drinking water has undisputable benefits for extending life expectancy. This is evident in the cluster of countries in the top right corner of the graph, including Ghana. However we can also suggest that access to clean drinking water is not the only factor to impact health. For example South Africa has 90 percent access but it's average life expectancy in 2008 was just over 50; more than 10 years lower than that of Ghana which has a lower access to water. The trend in South Africa can be explained of course by the devastating HIV/AIDS pandemic. The common trend running across Sub-Sahran Africa is that of low life expectancy. Its range according to this graph is 46 to 66 percent. However access to safe drinking water for the same region ranges form 30 to 95 percent, showing no obvious pattern. It is therefore important to infer that each country has its own set of socio-economic and environmental factors that feed into lower life expectancy. Access to safe drinking water is only one factor of many.
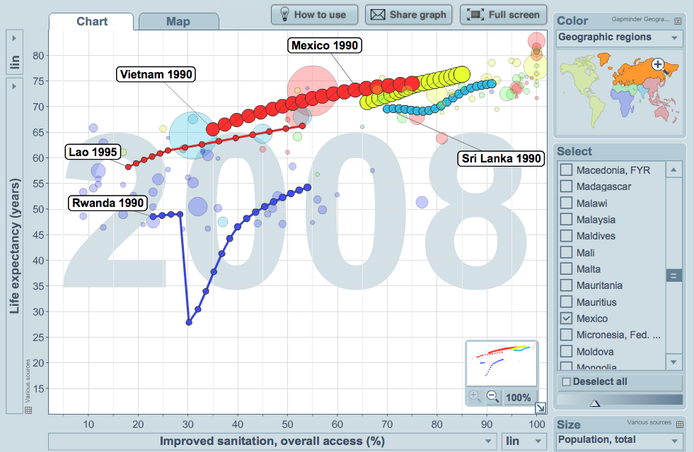
The following graph compares access to improved sanitation. If you click on it it takes you to the interactive version where I have attached some trails to show the pattern of change over time. There seems to be a much clearer global pattern in this graph. The general pattern shows a positive relationship between improved sanitation and higher life expectancy, the cluster of countries in Sub-Sharan Africa with low life expectancy show a clear shift to the left in comparisaon to the earlier graphic on safe drinking water. This perhaps suggests a much stronger causal relationship between poor sanitation and life expectancy. If we look at the raw UN data on sanitation for 2008 the figures suggest that 2.6 billion people had no access to a hygienic toilet or latrine and over 1 billion people were defecating in the open. It is therefore no surprise that the general pattern of provision of sanitation in countries is far more varied than compared to clean drinking water. As you can see we don't see the same concentration of countries in the top right corner of the graph.
Access to Health Services
Access to health services refers to the quantity of health care provision in the population. A general indicator for health services is doctors per 10000 of the population but other indicators examine the number of hospital beds, nurses and midwives or health expenditure. Nagle and Cook's IB course companion cites the World Health Report 2006, which explains that countries with fewer than 23 physicians, nurses and midwives per 10 000 of the population generally fail to achieve coverage rates for selected primary healthcare interventions as prioriised by the UN's Millenium Development Goals.
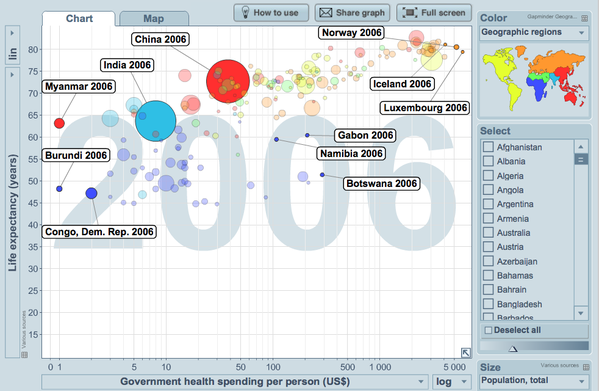
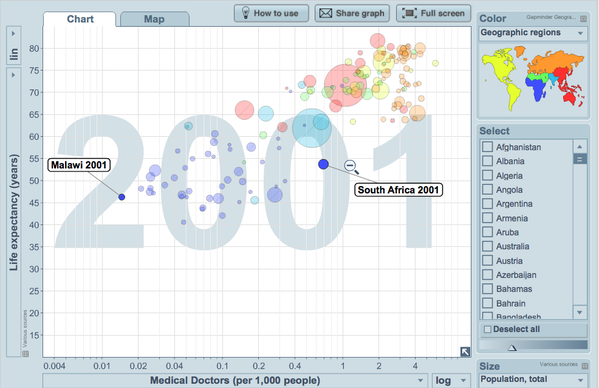
This final graphic above shows government spending per person and due to the extremity of the range it's presented on a logarithmic scale. The graph highlights selected countries. Government spending per head of population in 2006 varied from $1 in Burundi and Myanmar to over $5000 in Norway and Luxembourg. In total there were 27 countries with health spends lower than $10 and a further 21 countries with lower spends than $20 of these 48 countries 75 percent have a lower than 50 life expectancy and more than 50 percent have a lower than 55 life expectancy. It seems quite apparent to me that health spending per head of population or per 10000 population represents a rather convincing indicator of general health in a country. The problem of health care provision in Sub-Saharan Africa becomes even more apparent when looking at doctors per 1000 of the population shown in the next graph. The extreme problem again shown on a logarithmic scale reveals a range (exluding Mauritius) of 0.015 doctors per 1000 in Malawi to 0.69 doctors per 1000 in South Africa. To state this a different way if doctors were evenly distributed across Malawi alongside population density there would be 66600 people for every doctor. The unfortunate reality however, is that doctors tend to be clustered in urban areas and remote rural regions that are home to the majority of people in low income countries don't get to see doctors.
Diseases of Affluence and Poverty

Source: Visualising Economics
Income by region is probably best indicated by Gross Domestic Product (GDP), which represents the gross value of all goods and services produced in a country in a year. To the left we can see that the regions of Japan, Europe and US , which have the highest life expectancy have dominated world GDP for some time. In 1950 the US and Europe had about an equal share of GDP. The big growth regions in GDP have been China, Latin America and Japan. This corrosponds nicely to the increases in life expectancy that have been observed in these countries and wider regions. It is also interesting to observe the decline in GDP of the group all other countries since 1950. With increased GDP and wealth countries demonstrate increased spending power on health. Development changes occur that improve the standard of living so that basic housing conditions, sanitation and hygiene improve, food supply becomes more controlled and more efficient and with improvements in education people are able to make informed choices on lifestyle. The following video from gampminder explains how regions at the national scale make choices in regard to improving health and health spending. The statistics suggest that countries develop differently depending on their key focus. Socialist countries like former USSR and Cuba have developed health care more rapidly whilst other countries prioritise economic growth ahead of health.
Source: New Zealand Child Poverty
|
The benefits of increased income at every scale from the country and region to the individual household has impacted life expectancy. The diagram (left) shows the problems of inadequate housing on children's health and so any change in the level of income of a household can have immediate impacts on health. This diagram is based on a New Zealand context but as soon as you imagine changing this to a
low-income country and perhap a slum settlement like those found in Dhaka, Bangladesh, the impacts on health become far more grave. This diagram also helps us examine lifestyle in more detail and it is important to recognise and understand the close relationship between income and lifestyle. As already stated lifestyle relates to cultural choices and therefore links to attitudes and conditions of the place you live. |
For example a child living in the slums of Dhaka may be expected to earn income from an early age. A simple way for a very young child to work is to rummage in waste sites for recyclable materials. This lifestyle is partly informed by poverty but also expectation. In this example we don't see choice but rather an attitude.
Lifestyle reflects the very fabrics and flows of a society. It is all embrasive and connects all our daily routines including the amount of sleep we have, our personal hygiene, the type and quality of food we consume, our sexual preferences and habits, our work and leisure balance. Many of these factors relate directly to our status in society in regard to education and wealth as well as our personal attitude to life. For example, there are 15 million smokers in France despite its direct link to cancer and increased mortality. France is an educated wealthy country in which just under 25 percent of its population choose to smoke.
The importance of lifestyle impacts on health become increasingly important as households or nations develop. This can be clearly seen in the epidemiological transition (ET). The ET is a phase of development in a country that reflects a sudden increase in population growth rates brought about by medical innovation in disease or sickness therapy and treatment. In the Demographic Transition Model (DTM) it is the second stage in which death rates fall suddenly and population increases rapidily. The ET shows that as a country develops there is a distinct change in the pattern of health. Countries witness rapidly declining infectious or communicable diseases and in time (stages 3 and 4 in the DTM) begin to see growth rates in non-communicable diseases (lifestyle diseases) such as increased rates of heart disease, cancer, eating disorders and stress related mental health issues. Some of these patterns can be seen in the following graphs.

|
|
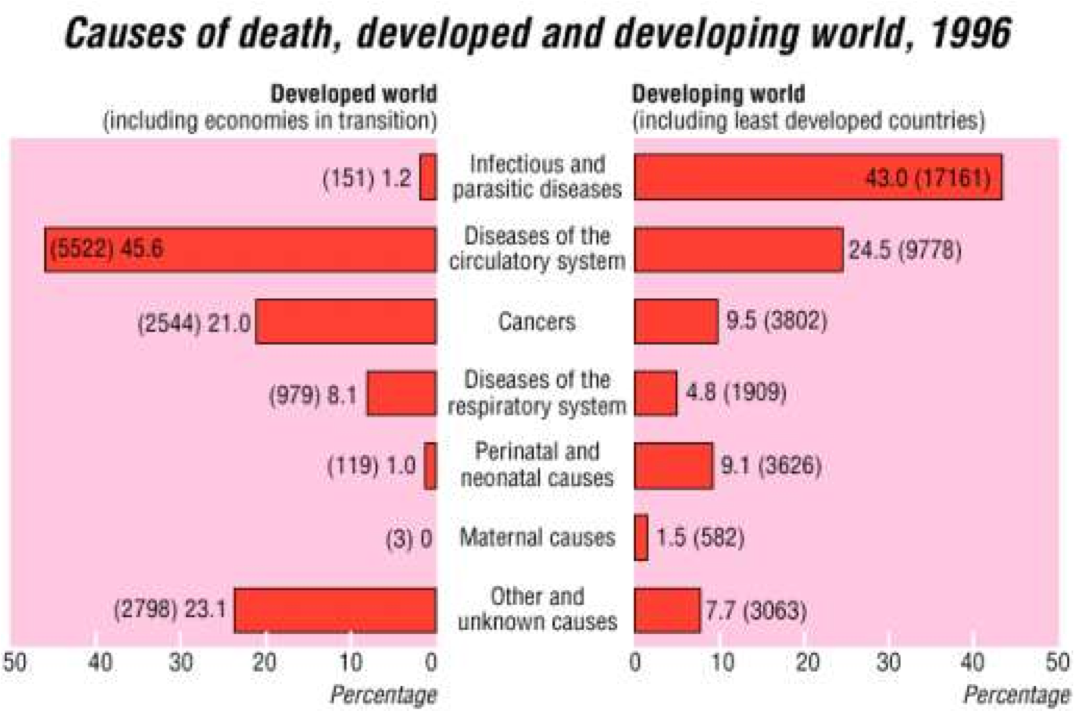
In the first graph we can see that as Mexico has developed between 1932-72 it's infectious diseases like diarrhea , typhoid, TB and Malaria all fall, with malaria almost entirely removed. The only disease to show growth over the same time period is coronary heart disease. CHD is directly linked to diet and lifestyle and is significantly less present in low-income countries. In the second graph comparing developed world with developing world the contrast between infectious and parasitic diseases couldn't be greater. In the developed world, diseases of the circulatory system, cancers and diseases of the respiratory system are all significantly greater and link more directly to lifestyle choices.
Hier klikken om te bewerken.
Source: Epidemiological transition, migration, and cardiovascular disease Francesco P Cappuccio
These changes to 'lifestyle' non-communicable diseases are considered by some commentators to take place quite rapidly. In a study by Francesco P Cappuccio the increase in cardiocvascular disease can be tracked in stages and is directly linked with increased rates of acculturation, urbanisation and affluence. These factors move people away from more traditional lifestyle into more urban and modern lifestyle. As a result diets change and work habits change.
In high income countries, despite improved leisure opportunities, the demands of society and work place enormous pressures on families. Food habits have changed dramatically, obesity is on the rise, binge drinking and alcohol dependence is common. Long working hours and the strain of a material society has impacts on health. At times it feels that those who live in the west like me have lost control over their lives to the extent that we no longer recognise the importance of just resting or sitting in silence or enjoying what we have. Anecdotally, it strikes me that most British rarely sit in their garden just to enjoy it. There is always the pressure to do something (write a blog), go somewhere, achieve it or buy it. How new this business is, is unclear, perhaps it just changes. People have in the past always had to do for necessity but there is a difference between doing to live and doing for possession and wealth. It seems to me the latter is unhealthy. But it must be noted that there is a group of the population who seem to thrive.
In high income countries, despite improved leisure opportunities, the demands of society and work place enormous pressures on families. Food habits have changed dramatically, obesity is on the rise, binge drinking and alcohol dependence is common. Long working hours and the strain of a material society has impacts on health. At times it feels that those who live in the west like me have lost control over their lives to the extent that we no longer recognise the importance of just resting or sitting in silence or enjoying what we have. Anecdotally, it strikes me that most British rarely sit in their garden just to enjoy it. There is always the pressure to do something (write a blog), go somewhere, achieve it or buy it. How new this business is, is unclear, perhaps it just changes. People have in the past always had to do for necessity but there is a difference between doing to live and doing for possession and wealth. It seems to me the latter is unhealthy. But it must be noted that there is a group of the population who seem to thrive.
Hier klikken om te bewerken.
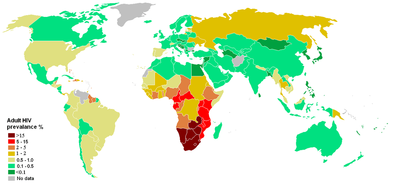
Another important disease to examine, which relates to both factors of income and lifestyle is that of HIV/AIDS. AIDs has devestated populations of some Southern African nations and there is a strong pattern that links this to poverty. At the macro scale the actual number of people with HIV is larger in some high income countries like the US but the percentage of people per country suffering from HIV is much larger in low income countries. At the household level poverty has a huge impact. It forces vulnerable girls into prostitution. This exposes them to greater risks of infection. With increased mobility men who have migrated to cities and find themselves in unfamiliar urban environments, with an absence of familly support are again more vulnerable to lifestyle choices and at greater risk. At the national scale, low-income countries have less resources and capacity to prevent and treat HIV/AIDs, education and literacy is poor and cultural taboo prevents use of contraception and weakens the status of women. Other cultural factors such as patriarchy, polygamy, sexual concurrency and greater age disparate intercourse are all important cultural factors that need to be considered when looking at why some sourthern African nations have been hit so hard by AIDS. All these cultural inform attitudes and lifestyle.
In general when examining disease of affluence and poverty we should be discussing the epidemiological transition and movement with wealth from infectious disease to non-communicable disease related to lifestyle. However, I like the way Nagle and Cooke develop it in the IB course companion as they develop a number of geographic factors that determine diseases of affluence. I would like to add to this further. Firstly age is a big factor. As countries develop and life expectancy increases through a whole host of developments and innovations, so the prevalence of chronic and degenerative diseases increase, these include CHD and alzheimer's. Secondly, wealth plays its role in regard to acculturation. People drive cars, exercise less, eat and drink larger quantities and eat more processed and fatty foods as a result of lost time and the inability to eat more traditional and healthy foods. The final geographical factor referred to is urban residence. Through urbanisation people have greater access to transport, they are released from the burden of rural farming and water and firewood hikes and their diet is significantly changed. For the latter I would say for the most part for the better in LICs but in HICs this would include more saturated fatty food and increased fast food and restaurant food.
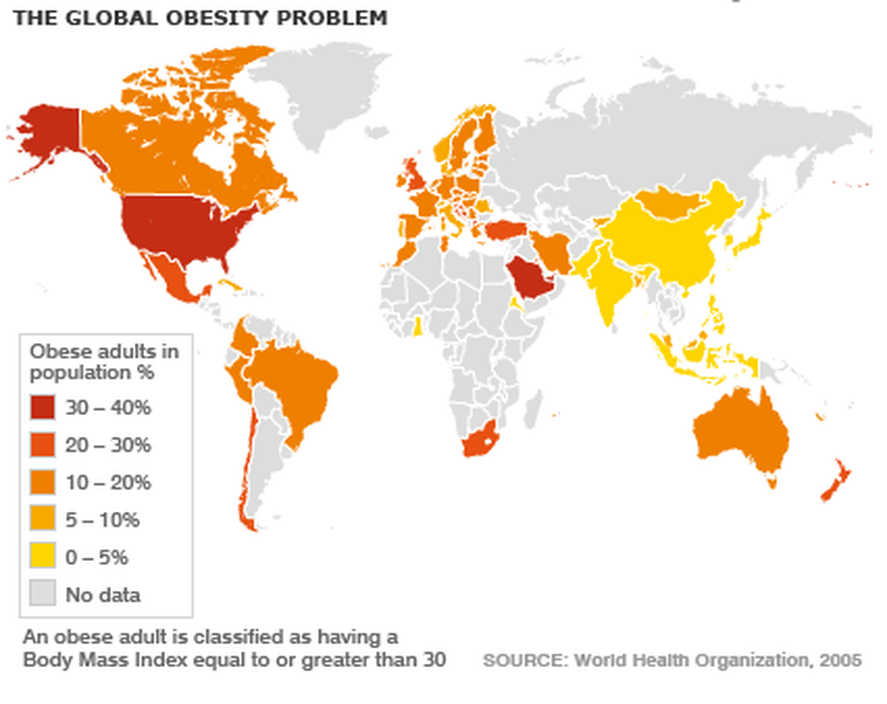
An important factor to look at in more detail are the acculturation factors of lifestyle change. For example, in LICs, low and middle income groups (mainly men) spend money on tobacco at the expense of the family's food and health budget. In HICs both tobacco and alcohol lead to longer term chronic illnesses and cancer. The rates of incidence for these diseases are also rapidly growing in LICs. A second concern related to affluence is that of obesity. Obesity is directly related to increased prevalence of diabetes, heart disease and certain types of cancers in HICS. Obesity is a bigger killer today in HICs than undernourishment and it is on the rise. There are many factors that are causing increased obesity. Many of which relate to social and economic developments related to corporate business and globalisation. Policies in areas of agriculture, especially the integration of the global food industry and loss of traditional foods in favour of more western high fat, high protein diets including increased (processed) meat consumption leads to weight gain. The manufacture of processed foods and dominance of super market or hypermarket retail and fast food retail is also having a profound impact on the way food is produced, distributed and marketed. The following videos visualise the growth of obesity in the USA and discuss the problems for health.
An important factor to look at in more detail are the acculturation factors of lifestyle change. For example, in LICs, low and middle income groups (mainly men) spend money on tobacco at the expense of the family's food and health budget. In HICs both tobacco and alcohol lead to longer term chronic illnesses and cancer. The rates of incidence for these diseases are also rapidly growing in LICs. A second concern related to affluence is that of obesity. Obesity is directly related to increased prevalence of diabetes, heart disease and certain types of cancers in HICS. Obesity is a bigger killer today in HICs than undernourishment and it is on the rise. There are many factors that are causing increased obesity. Many of which relate to social and economic developments related to corporate business and globalisation. Policies in areas of agriculture, especially the integration of the global food industry and loss of traditional foods in favour of more western high fat, high protein diets including increased (processed) meat consumption leads to weight gain. The manufacture of processed foods and dominance of super market or hypermarket retail and fast food retail is also having a profound impact on the way food is produced, distributed and marketed. The following videos visualise the growth of obesity in the USA and discuss the problems for health.
|
|
UK and Global Case Study: Obesity - Just click on the map to take yu to the BBC site on Obesity statistics
Hier klikken om te bewerken.
Critique of the Epidemiological Transition
The change in the patterns of disease for a country as it develops is clearly understood in the model. As a country develops and becomes more affluent it is able to control and treat infectious diseases. As people become more wealthy they adopt lifestyle habits that develop associated illnesses that are non-communicable. These illnesses relate to degenerative health associated with long life extpectancy and chronic health issues related to lifestyle such as work, food and lack of exercise. However, it is important to stress that countries often struggle to develop at the same rate and so wealth varies enormously within regions. It is very common to find spatial variations in wealth within regions such as an urban and rural divide or core-periphery divide. In such socio-economic conditions it is very possible that in urban environments where access to better health care and food prevails, infectious disease may fall. Having said that high density and squallid shanty towns remain a breeding ground for disease whilst high income gated communities within the same city enjoy the luxuries of landscaped gardens and modern sanitation. The example of HIV/AIDS shows that it spreads more quickly amongst middle to high income groups within LICs and for that matter, the affluent homosexual community of HICs also see greater prevalance. The factors that explain this relate to lifestyle, freedom of movement and migration. More affluent people can afford to migrate to cities and in doing so place themselves in more vulnerable situations.
Hier klikken om te bewerken.
Furthermore, the pattern of declining infectious disease in HICs can also be brought into question. The map of the US to the left shows increasing prevalence of TB in foreign-born persons and it appears to be quite alarming. With increased migration from LICs into HICs infectious disease in HICs is on the rise. Immigrants come into HICs having experienced much poorer conditions. On arrival in HICs many struggle to get by and often find themselves living in damp and poor quality city slum housing. Sometimes with many people sharing the same rooms. These conditions within HICs remain breeding grounds for infectious diseases like TB. TB is on the rise in most HIC cities including London.
