|
|
|
Urban Climates
Source: www. urban-climate-energy.com
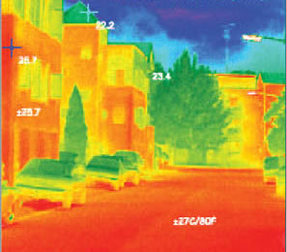
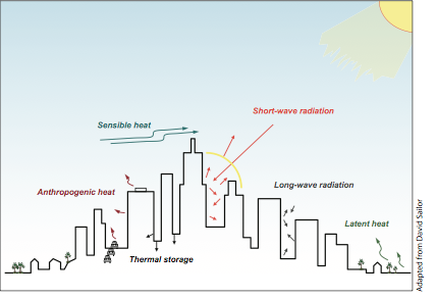
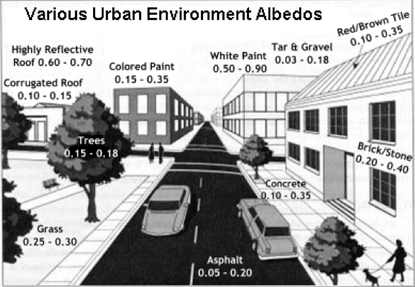
The two images above and to the left show an infra-red thermal image of heat being emmitted in Tokyo. The first thing to be observed is the contrasting levels of heat in relation to urban features. Large concrete buildings and roads due to their thermal capacity store and emmit greater heat than the lighter surfaces and vegetation. From the image within Tokyo it becomes clear that we should also expect a temperature gradient along a rural-urban transect. This temperature gradient is known as the Urban Heat Island Effect. The Urban heat island effect is caused by a number of factors but primarily the nature of the building materials. Building material have vastly different physical properties to soils and plants. Concrete and bitchamin warm up rapidly in the day time in contrast to waterways and parks. Due to the nature of the surface its albedo is lower. Much more heat is absorbed and conducted through the material. This heat is then slowly released during the night, adding warmth to the urban atmosphere. This keeps urban climates relatively high and the contrast between the urban environment and the rural fringe is greatest at night. Building materials therefore have heat storage capacities. Another factor that leads to an urban heat island effect relates to the amount of pollutants in the atmosphere. Cities are home to industry and many homes, that remain heated through winter months, people are mobile and vehicle combustion is also a huge factor of consideration. Research shows that on Manhattan Island, in the average January, the amount of heat produced from combustion alone is greater than the amount of energy from the sun by a factor of 2.5. In summer this ratio is only 0.15. The urban surface energy budget can be seen in the diagram below.
Source: Reducing Urban Heat Island Effects, and modified from FSRWG.
|
|
Reducing Urban Heat Island Effects, and modified from FSRWG.
|
Source: Reducing Urban Heat Island Effects, and modified from FSRWG.
|
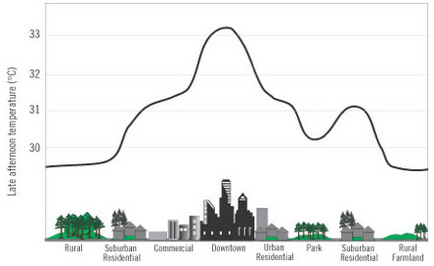
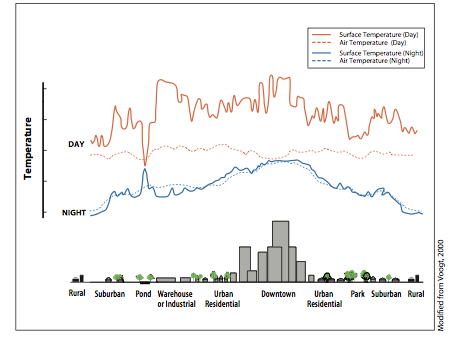
The two diagrams above show a rural-urban transect from the rural urban fringe through to the high-rise characteristics of the central business district and back to the rural-urban-fringe. A number of observations can be made. Firstly, the urban temperatures are at their highest in the mid-afternoon over the the CBD. Also secondary nodes or peaks of high temperature apppear over significantly built-up areas such as that seen over the suburban residential areas. A second observation tells us that at night temperatures are significantly lower than day time temperature. Although the temperature range from rural to city centre is often greatest at night due to the high heat storage capacity of building materials compared to vegetation.
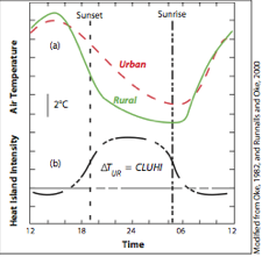
Diurnal heat change with calm atmospheric conditions
Reducing Urban Heat Island Effects. Modified from FSRWG.
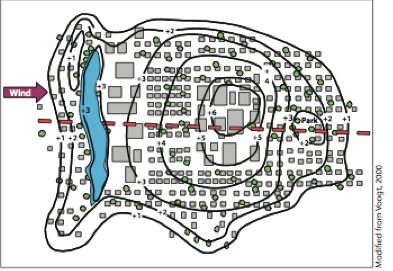
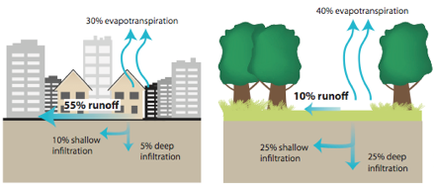
The graph to the left shows two sections. Section A shows the contrast in cooling between urban and rural areas. Both surfaces begin to cool several hours before sunset but rural areas cool rapidly compared to urban area that retain heat better. Rural temperature during calm atmospheric conditions are also seen to fall lower than urban temperatures. Section B shows the heat island intensity growing mid-late afternoon and at its highest a few hours after sunset. The isotherm map below shows lines of equal atmospheric temperature for a hypothetical city. The second diagram shows the differences in evapotranspiration and run-off. Urban areas are characterised by 75-100 percent impermeable material and experience have less evapotranspiration than rural areas, which may have only 10% impermeable material. This difference contributes to higher surface area temperatures.
Reducing Urban Heat Island Effects. Modified from FSRWG.
|
Source: Reducing Urban Heat Island Effects, and modified from FSRWG.
|
Urban Canopy and Urban Boundaries
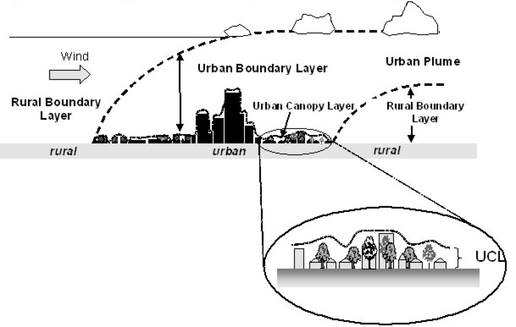
When discussing the urban heat island effect a number of distinctions should be made. Firstly there are three types of heat islands:
- urban canopy layer
- urban boundary layer
- urban surface heat
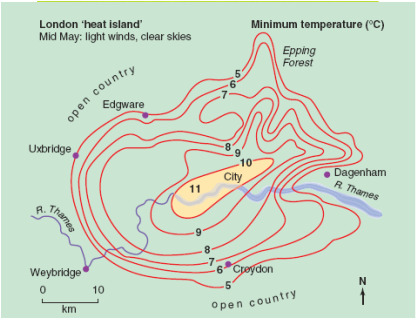
The Urban Heat Island in London.
Source: Probably Waugh
When discussing the nature of urban heat island effect it is important to develop place evidence. The isotherm map below of London shows the pattern of temperature for the UCL in mid May during calm atmospheric conditions. Clear skies and light winds provide the best conditions for a more pronounced heat island effect. The general pattern in the diagram shows temperatures at their highest in the city core, reaching 10-11°C, which contrasts with the rural finge of temperature of 5°C. However it is is also important for you to describe and explain spatial variation within London. Where isotherms are close together there is a steeper temperature gradient. Here temperature falls more rapidly over a shorter period of time. This can be seen along the River Thames to the east of the City. Where isotherms are more dispersed, the temperature gradient is more gentle, temperature remains more constant over a longer distance. This can be seen to the west of the city. In order to explain this pattern you must consider the density of urban infrastructure. Over steep temperature gradients you will find low density of urban infrastructure, e.g the river and its vegetated banks (in places). Where we see a gentle temperature gradient we will find high density urban infrastructure. Effectively from the map we can see that the east of London is less built up than the west. As we move away from the City to the west, temperature remians relatively constant for approximately 15 km before rapidly falling within a 5-6km distance.
Have a go at describing and explaining the urban heat island effect shown in the land surface temperature map of Baltimore below. the second image is the extent of urban development.
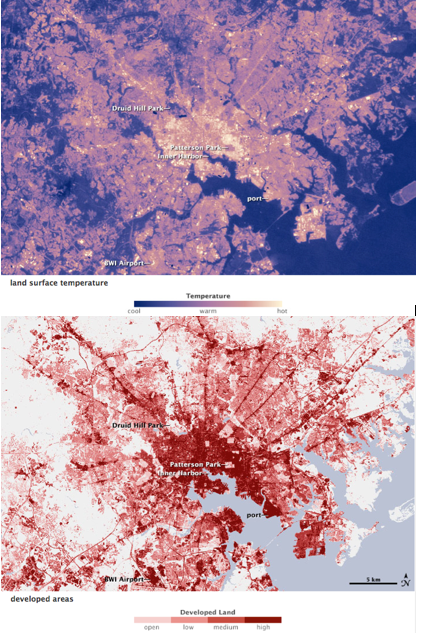
Source: NASA
|
|
|
Precipitation Patterns in Urban Areas
In the UK urban areas are thought to increase the amount of precipitation over the UK by as much as 30 percent. The number of rainy day are increased by 10 percent, although snow and hail days are reduced by 14 percent. Finally the amount of fog experienced in the UK is doubled.
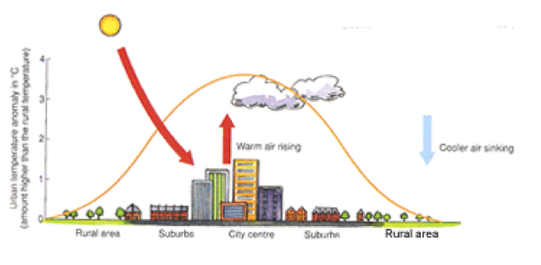
There are a number of reasons for increased patterns of precipitation in urban areas compared to rural areas. The diagram to the right shows how the Urban Boundary Layer (UBL) creates a dome of rising warm air and low pressure. As ground surfaces are heated rapid evapotranspiration takes place. This evapotransipration although lower compared to rural areas occurs more rapidly and can result in cumulus cloud and convectional weather patterns. A second factor is convergence. Due to the low pressure caused by rising air surface winds are drawn in from the surrounding rural fringe. This air then converges as it is forced to rise over the high urban canopy. A similar process occurs as the prevailing wind moves over the city. Friction from the urban boundary essentially creates an orographic process similar to a mountain barrier, but sometimes moving air splits apart due to the building barriers. As they come back together downwind of the core they are thought to converge and rise upwards forming rain clouds. The movement of winds contribute to increased rainfall patterns over the city that are most pronounced to the leeward side of the city core. However as air passes over the UBL it begins to sink leading to lower precipitation at the leeward rural area. These differences are also more procounced in the summer than compared to the winter.
There are a number of reasons for increased patterns of precipitation in urban areas compared to rural areas. The diagram to the right shows how the Urban Boundary Layer (UBL) creates a dome of rising warm air and low pressure. As ground surfaces are heated rapid evapotranspiration takes place. This evapotransipration although lower compared to rural areas occurs more rapidly and can result in cumulus cloud and convectional weather patterns. A second factor is convergence. Due to the low pressure caused by rising air surface winds are drawn in from the surrounding rural fringe. This air then converges as it is forced to rise over the high urban canopy. A similar process occurs as the prevailing wind moves over the city. Friction from the urban boundary essentially creates an orographic process similar to a mountain barrier, but sometimes moving air splits apart due to the building barriers. As they come back together downwind of the core they are thought to converge and rise upwards forming rain clouds. The movement of winds contribute to increased rainfall patterns over the city that are most pronounced to the leeward side of the city core. However as air passes over the UBL it begins to sink leading to lower precipitation at the leeward rural area. These differences are also more procounced in the summer than compared to the winter.
|
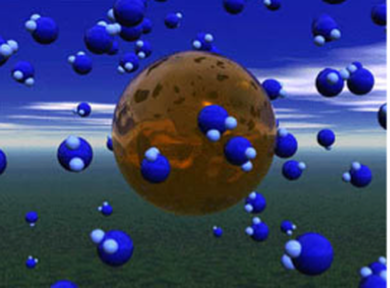
In addition to the role of the UBL, precipitation is also thought to be increased in urban areas by the amount of air pollution. This is well understood in regard to fogs and smogs that develop over cities but increasingly more consideration is being placed on the role of fine particulates increasing the amount of condensation nuclei. Clouds form as water vapour is attracted to condensation nuclei or hygroscopic nuclei in the atmosphere. This nuclei is typically fine ice particles, pollen or dust, but with increased use of vehicles and industry in urban areas, fine particulate matter is increased in the urban atmosphere, in turn increasing the amount of condensation nuclei for water vapour to attach to. Some studies have demonstrated a pattern of increased rain through the week and have shown Saturday rain to be a result of a build up of pollutants due to five consecutive commutes. By Monday pollutants have fallen and rainfall is less likely to form.
|
|
Fog and Photochemical Smog.
Photochemical fog is a very specific type of air pollution, which is caused by reactions between sunlight and atmospheric pollutants such as hydrocarbons and nitrogendioxide. Photochemical smog is often invisible but can be extremely harmful, with it being responsible each year for elevated rates of death and respiratory illnesses.
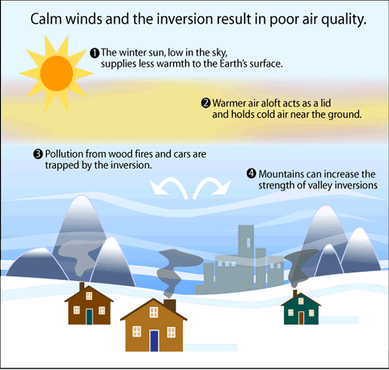
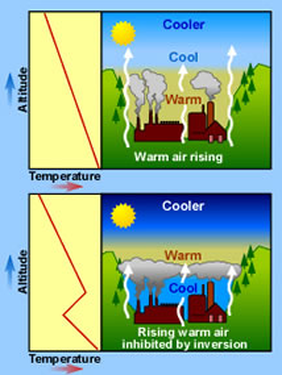
Smog itself is simply airborne pollution which may obscure vision. It is caused by small particles of material which become concentrated in the air for a variety of reasons. Commonly, smog is caused by an inversion, in which warm air presses down on a column of cold air. This warm causes traps cold air beneath it forcing the air to remain stationary.
Smog itself is simply airborne pollution which may obscure vision. It is caused by small particles of material which become concentrated in the air for a variety of reasons. Commonly, smog is caused by an inversion, in which warm air presses down on a column of cold air. This warm causes traps cold air beneath it forcing the air to remain stationary.
|
|
Some of the particulate matter in the air can oxidize very readily when exposed to sunlight. Nitrogen dioxide and various hydrocarbons produced through combustion will interact with sunlight to break down into hazardous chemicals. This doesn't necessarily have to mean just sunny days as UV light can also penetrate clouds. The pollutants released through human activity in this situation are known as “primary pollutants,” and they include sulfur dioxide, cartbon monoxide, and other volatile organic compounds. When these compounds interact with the sun, they form “secondary pollutants” like ozone and additional hydrocarbons.
|
|
|
Particulate Matter and Health
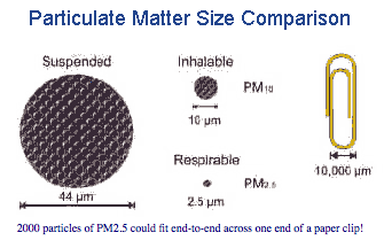
Since the late 1970's, environmental agencies have generally only monitored particulate matter pollution that was 10 microns in diameter or less, called PM 10. A micron (or micrometer) is a millionth of a meter. To provide a comparision for you, the dot above the letter "i" in a typical newspaper measures about 400 microns!
PM 10 particles are small enough to be inhaled and accumulate in the respiratory system. In the last decade, health studies indicated that particles even smaller than PM 10 can cause even more health problems! Now, in addition to monitoring PM 10, scientists and technicians monitor fine particles called PM 2.5, these particles measure 2.5 microns in diameter or smaller. These tiny particles are about 30 times smaller than the width of a hair on your head! These tiny particles are small enough to get inhaled into our lungs and from there they can pass into our blood supply and be carried throughout our bodies.
PM 10 particles are small enough to be inhaled and accumulate in the respiratory system. In the last decade, health studies indicated that particles even smaller than PM 10 can cause even more health problems! Now, in addition to monitoring PM 10, scientists and technicians monitor fine particles called PM 2.5, these particles measure 2.5 microns in diameter or smaller. These tiny particles are about 30 times smaller than the width of a hair on your head! These tiny particles are small enough to get inhaled into our lungs and from there they can pass into our blood supply and be carried throughout our bodies.
Urban Winds
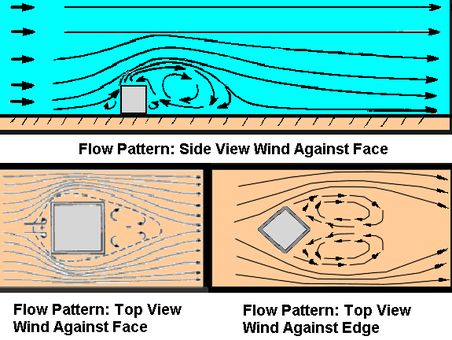
Generally speaking urban wind speeds are thought to be lowered by the friction and barrier of the urban canopy. The surface area of cities is uneven because of the varying height of the buildings. Buildings exert a powerful frictional drag on air moving over and around them. This creates turbulence and can cause rapid and abrupt changes in wind direction and speed. However under intense heating strong convectional processes form low pressure thermals over cities that can draw in strong localised winds.
As you can see from the diagram to the right large buildings interact with wind to create divergence and convergence and on the leesside of buildings strong eddies. In contrast to the windward side of a building where strong uplift can be observed.
As you can see from the diagram to the right large buildings interact with wind to create divergence and convergence and on the leesside of buildings strong eddies. In contrast to the windward side of a building where strong uplift can be observed.
|
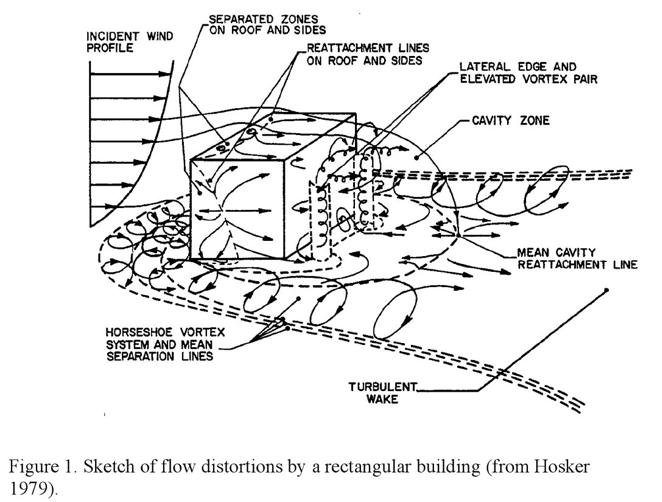
The pattern of wind movement around buildings can be incredibly complex, with horseshoe vortex systems developing down the flanks of buildings and strong eddies developing as air descends on the leeside of the buildings. Due to variations in surface temperature, localised pressure gradients can occur that help form stronger localised gusts of wind. These can be strong enough to knock you off your feet! City structures and city design can also create urban canyoning where the placement of buildings artificially increases the intensity and direction of wind movement between buidlings.
|
|
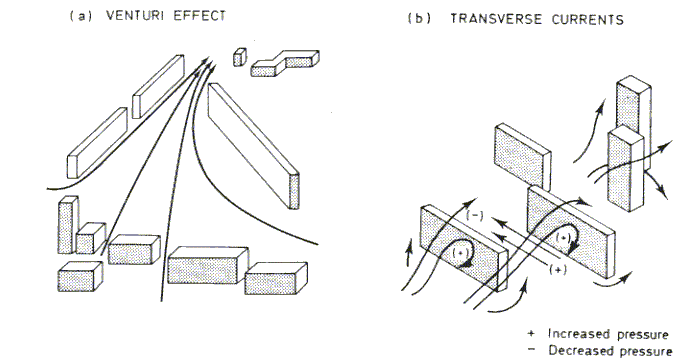
Below roof level, in the urban canopy, wind act in the spaces between buildings. Above the urban boundary layer the dome extends downwind as a plume into the surrounding rural area. As can be seen above high buildings slow air movement and also channel it into the ‘canyons’ between them. They can be powerful enough to make buildings sway and knock people off their feet! A single tall building pushes air above and to the side of it. It also causes air to descend behind it in its leeside. Air on the windward side of a building creates high pressure and is forced to descend. This is increased with height. As it hits the ground it creates a vortex as it sweeps around side corners. In the lee of the building there is zone of lower pressure which creates vortices. If two separate buildings are in close proximity to each other they may be subject to the Venturi-Effect where by the pressure difference within the gap causes wind to increase in strength and to reach high velocities. Where buildings are close to each other it produces complex patterns of air flow. The Venturi-Effect is a phenomenon observed in fluid dynamics. In fluids (such as wind) an increase in velocity when flowing through constricted spaces of cities is observed. This effect has been observed in major cities across the world as predominant winds are forced through a dense network of high-rise buildings. During calm and clear nights when the UHI is at its greatest there is air movement from the cooler rural periphery into the warmer city centre.
Venturi-Effect Turbine Array from Kevin Frank on Vimeo.
Managing Pollution in Urban Areas
Background
As urban area struggle to comply with air quality standards, the ways that trees can help to clean the air should not be overlooked. The most serious pollutants in the urban atmosphere are ozone, nitrogen oxides (NOx), sulfuric oxides (SOx) and particulate pollution. Ground-level ozone, or smog, is created by chemical reactions between NOx and volatile organic compounds (VOCs) in the presence of sunlight. High temperatures associated with the UHI increase the rate of this reaction. Vehicle emissions, emissions from industrial sites and chemical solvents are the major sources of NOx and VOCs. Particulate pollution, or particulate matter (PM10 and PM25), is made up of microscopic solids or liquid droplets that can be inhaled and retained in lung tissue causing serious health problems. Most particulate pollution begins as smoke or diesel soot and can cause serious health risk to people with heart and lung diseases and irritation to healthy citizens. Trees are an important, cost-effective solution to reducing pollution and improving air quality.
With an extensive and healthy urban forest air quality can be drastically improved. Trees help to lower air temperatures and the UBIin urban areas through increasing evapotranspiration.This reduction of temperature not only lowers energy use, it also improves air quality, as the formation of ozone is dependent on temperature.
Large shade trees can reduce local ambient temperatures by 3 to 5 °. Maximum mid-day temperature reductions due to trees range from 0.04 °C to 0.2 °C per 1% canopy cover increase A study in Sacromento County in California estimated that doubling the canopy cover to five million trees would reduce summer temperatures by 3°C. This reduction in temperature would have a direct impact in air quality, reducing peak ozone levels by as much as 7% and smoggy days by 50%.
Temperature reduction from shade trees in parking lots lowers the amount of evaporative emissions from parked cars. Unshaded parking lots can be viewed as miniature heat islands, where temperatures can be even higher than surrounding areas. Tree canopies will reduce air temperatures significantly. Although the bulk of hydrocarbon emissions come from tailpipe exhaust, 16% of hydrocarbon emissions are from evaporative emissions that occur when the fuel delivery systems of parked vehicles are heated. These evaporative emissions and the exhaust emissions of the first few minutes of engine operation are sensitive to local microclimate. If cars are shaded in parking lots, evaporative emissions from fuel and volatilized plastics will be greatly reduced. Cars parked in parking lots with 50% canopy cover emit 8% less through evaporative emissions than cars parked in parking lots with only 8% canopy cover.
Trees also reduce pollution by actively removing it from the atmosphere. Leaf stomata, the pores on the leaf surface, take in polluting gases which are then absorbed by water inside the leaf. . Ideally, trees should be selected that take in higher quantities of polluting gases and are resistant to the negative affects they can cause. In addition to the uptake of harmful gases, trees also act as filters intercepting airborne particles and reducing the amount of harmful particulate matter. The particles are captured by the surface area of the tree and its foliage. Large evergreen trees with dense foliage collect the most particulate matter. A study in Chicago in1991 determined that trees removed approximately 234 tonnes of particulate matter less than 10 micrometres (PM10).
|
|
|
|
|
|
|
|
|
