Introduction to River Processes
Before looking at river landforms it is important to understand the more general role of rivers and to develop an awareness of the processes at work within rivers. It is through this knowledge that we will better undertand the processes at work in the geomorphology of the drainage basin. The role of rivers can be understood in very simple terms. The river's role is to balance its load and transport it to the ocean. But this idea of rivers, as merely transporting weathered material to the ocean is too simplistic. In reality the river changes in energy, discharge, velocity, channel charactersitics and load as it extends down its course. These changes show a recognisable pattern, that you may be familiar with from the Geography textbook. In reality however, there is a great deal more variation. The river is in constant interaction with its physical environment as well as climate and human factors. This interaction leads to considerable variation in both the landforms and processes of rivers. These variations can be seen at both a spatial and temporal scale.
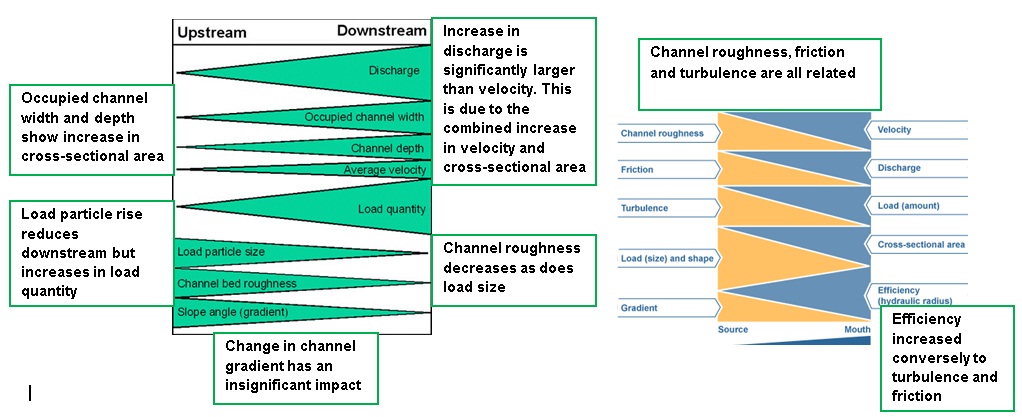
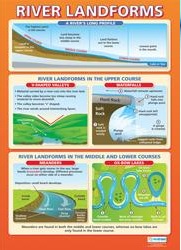
It's well known that rivers increase in size as they transport water from their source in their headwaters to the mouth. The river channel becomes wider and deeper and as a result its cross-sectional area increases. We can also observe along the river's course an increase in both quantity of water and bedload. The nature of bedload also changes downstream. In the upper course of the river bedload is larger and more angular. As we track the river downstream bedload becomes much smaller and smoother. In the lower course bedload can only really be found in the form of fine sediments and muds, known as alluvium.
Some other changes in the river are measurable rather than observed. Two of these changes are an increase in discharge and and an increase in velocity downstream. Remember that discharge is the quantity of water passing a given point at a given time, measured in cumecs. It is calculated by multiplying cross-sectional area by velocity. As already stated it is possible to observe an increase in cross-sectional area downstream and so it's plausible that given this factor is a key element of discharge we will discover a corresponding increase in discharge. The more difficult change to explain is the increase in velocity downstream.
Many students struggle with this idea, as sometimes in our observation of rivers we see that rivers are fast flowing in the upper course but can sometimes hardly be seen to be moving at all in the lower course. Well yes and yes! It is true that on the surface, water does appear to be moving fast in the upper course and with a steeper gradient of the river channel, this misconception is understandable. However, we need to consider in more detail the precise interaction between the flowing river and its physical environment. In the upper course, rivers appear to be flowing fast at waterfalls and sections of rapids. They produce white water and turbulence. However, the very presence of turbulence shows us that the water is being thrown up and in fact is inefficient in its flow. This inefficiency is caused by friction with rocks and channel roughness. This is contrasted with the smooth more 'laminar' flow of the river in the lower course. In the lower course there is an absence of large rocks and the river channel, being wider and deeper applies less friction to the flow. It is this absence of friction, which creates the smooth channel that allows the velocity of rivers to increase despite the more shallow gradient of the channel. The efficiency of flow can alos be shown in the hydraulic radius of a river. HR can be aclulated by the dividing the cross sectional area of a river by it measured wetted perimeter. The wetted perimeter refers to the bed and bank that is in direct contact , therefore friction with the river. High HR shows high efficiency and higher velocity. Low HR shows lower efficiency and lower velocity.
The River Long Profile
The River Long Profile
As we have noted already the processes and interaction of the river with its physical environment changes ast it flows from source to mouth. A key influencing factor is the long river profile, illustrated in the diagram to the right. The long profile is a graph of a river that marks the change in altitude from the upper course to its lower course. All along its course, the river uses energy to carry out erosion, transport and deposition of sediment. This energy is produced when water flows down a slope.
At this point we can introduce two types of energy, potential energy and kinetic energy. A still body of water at any point above sea level has a certain amount of stored energy, this is called potential energy. Its quantity depends on the altitude of the water. Kinetic energy comes from the movement of the water and is derived from it's potential energy. The discharge, gradient and average velocity all determine the amount of kinetic energy. An increase in velocity and/or discharge will see an increase in kinetic energy.
The lowest level of a river is called the base level, this is normally found at sea level. The study of river long profiles shows that they have a concave shape, with a steeper upper section and a gentle lower section. Every river is attempting to balance its energy, load and waterflow. River processes are related to the long profile because every river is trying to achieve a smooth, concave, long profile. It is in this profile that the river is balanced. Where this is not the case, the river will be working to smooth out its long profile by erosion, transport or deposition, in order establish the balance. A graded profile is the term given to the long profile of a river in equilibrium, when inputs and outputs are balanced. A graded profile shows a gradient that decreases progressively down valley to sea level.
In more traditional text books the river in its three sections, has been characterised as having a dominant role or function. Namely in the upper course, the river is eroding bedrock. In the middle course the river is thought to be transporting this eroded material and in the lower course, the river's transported bedload is deposited. In many repects this remains largely the case and when thinking in general terms, such as the long profile this remains a useful way of distinguishing between the three sections. However, river systems are dynamic and their interaction with the physical environment is in constant change; huge variation can therefore be observed at the local scale. The diagram above is also useful for outlining how erosion varies between the upper course and middle course. In the upper course at higher altitude, the river has higher potential energy. This energy enables the river to cut down vertically creating steep v-shaped channel profiles. In the middle course, the altitude is lower and so therefore the potential energy has fallen. However, due to increased discharge and average velocity the river is still able to erode its banks through lateral erosion. The same processes are at work in the lower course, but due to the development of floodplains and the river delta rivers now deposit thier alluvium.
Erosion
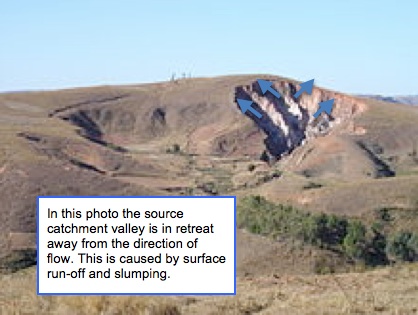
Rivers erode landscapes and in the process, they create new landforms and new landscapes. Rivers do not act alone in breaking down the landscape. Rivers are assisted by the processes of weathering and mass movements. Weathering can be defined as the breaking down of rock in situ. In the upper course, rocks are commonly eroded by physical weathering such as frost shattering. Frost shattering creates scree slopes of small rock chippings, which are commonly found on north facing slopes in the northern hemisphere. Other types of weathering include, biologial and exfoliation. Chemical weathering is also present in certain rock types. Limestone is affected by carbonation for example, a process whereby carbon acid in rainfall reacts with calcium carbonate to form the soluable calcium bicarbonate. Steep slopes are also subject to mass movements. Rapid movements like rock falls and landslides can dramatically change the landscape in a single event. The evidence of the latter can be seen in vertical scars and hummock tongues of slumped material. Other materials are constantly in a slow motion movement downslope under the influence of gravity. This form of mass movement is known as soil creep. All of these factors including river erosion are at work in reshaping the geomorphology of the river environment. Through these combined processes the landscape evolves and can be classified in terms of its youthfulness or maturity.
University of Wisconsin: Young River Landscape
University of Wisconsin: Mature (late) River Landscape
|
University of Wisconsin: Mature (early) Landscape
University of Wisconsin: Old Age River Landscape
|
Types of Erosion
There are four types of erosion within the river. Three of which are important to explaining how the river channel is eroded. Abrasion, hydraulic action and solution all erode the bed and banks of the river, hence deepening and widening the river. Hydraulic action refers to the force of the water's flow against the banks and bed. Sometimes the bank becomes over saturated and just slumps into the river. Abrasion refers to the way in which the suspended load, transported by the flow collides with the bed and bank. This is sometimes anecdotedly referred to as the 'sandpaper effect'. Solution is the chemical reaction between carbon acid in the water and mineral elements in the rock. A fouth type of erosion is attrition. Attrition is unique because it directly relates to erosion of bedload rather than the bed and bank. Attrition takes place through small collisions between bedload material. This is well illustrated in the video on transportation.
Juicy Geography Animations
Erosion within the Long Profile
As already stated earlier, the river has greater potential energy to erode in the upper course of the river. This is due to the height difference between its altitude and the base level. As a result of this potential energy and the need for the river to cut down and balance its energy the river vertically erodes in the upper course. In the middle and lower course the river has increased in discharge as well as suspended load. As a result, the river erodes laterally on it banks. The consequence is a wider river channel. There is however, one other form of erosion, known as headward erosion. Headward erosion derives its name from the direction of the erosion back towards its head waters. Headward erosion is most clearly seen at waterfalls. Waterfalls form in channels with different bands of resistent rock. There is often a band of resistent rock overlying a softer rock. The softer rock, which is more easily eroded undercuts the more resistent overlying rock, untill it collapses. This process of undercutting erodes headwardly causing the waterfall to retreat upstream. Headward erosion is also common at its source where the spring of a river emerges from unconsolidated material.
Active Headward Erosion: Wikapedia
Transportation
|
|
|
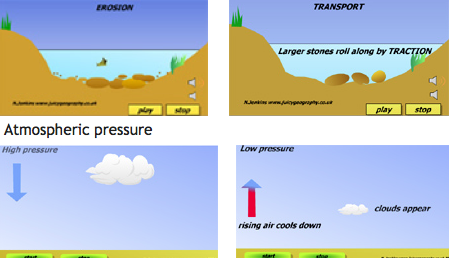
The videos above show the transportation of bedload in a river. Notice how small bedload is suspended in the flow, whilst larger bedload bounces along the bed through saltation. We can also observe traction as the largest bedload partcicles roll along the bed. All the time there are mini-collisions and in this way we can observe the process of attrition at work. It's important that we make the link between the river's ability to transport through traction and saltation and the process of attrition. Abrasion is also at work as bedload collides with the bed of the river. In addition, it is possible to observe in some river sheet flow. The second video shows how a whole sheet section of the river bed can be transported as one sheet.
These processes of transportation are explained in more detail in the diagram below:
These processes of transportation are explained in more detail in the diagram below:
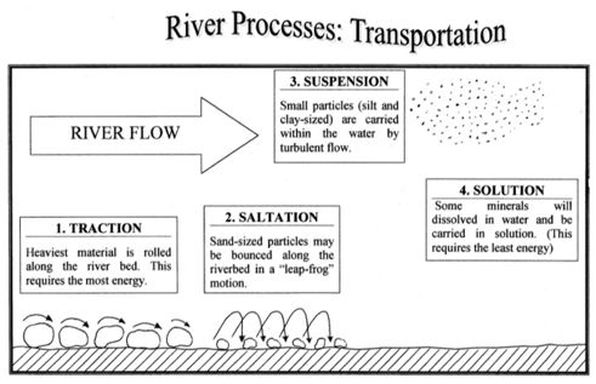
The ability of the river to transport bedload depends on a number of factors, primarily its energy, but of course discharge and average velocity are closely related. Hydrologists use the term channel efficiency to describe the river's ability to transport bedload and discharge. Hydraulic radius is a measure of channel efficiency. Hydraulic radius is measured by dividing the cross- sectional area by its wetted perimeter. Wetted perimeter refers to the wetted length of bed and bank. The higher the hydraulic radius the greater the channel efficiency. Smooth semi-circular channels are the most efficient channels and are located more often further downstream. Roughness in the channel, which describes the quantity of large and angular bedload increases the wetted perimeter. Large bedload creates turbulent inefficient flow in the channel. The channel in the upper course is more often shallow and cluttered with large angular bedload. As a consequence it has low channel efficiency and therefore the quantity of transported bedload is lower. The quantity of bedload that a river is able to transport is known as capacity. Capacity of a river increase downstream.
Test your transport vocabulary
Test your Erosion vocabulary
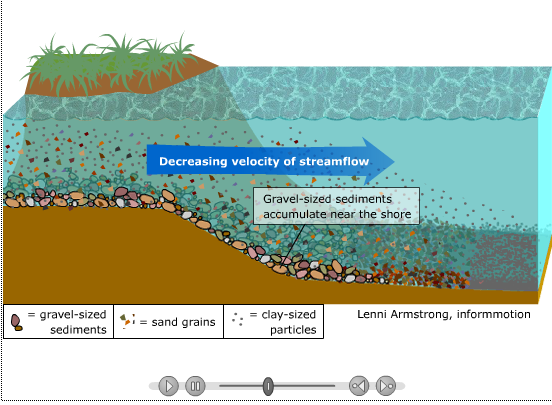
The following animation shows how sediment is sorted when entering lakes. It's the same process when sediments enter deltas at the mouth of the river.
Test your transport vocabulary
Test your Erosion vocabulary
The following animation shows how sediment is sorted when entering lakes. It's the same process when sediments enter deltas at the mouth of the river.
McDougal Littel
Hjulstrom Curve
Hjulstrom Curve
The competence of the river refers to the maximum bedload size that the river is able to transport and this is directly related to the velocity of the river. The Hjulstrom curve is a useful graph for showing the relationship between bedload size, velocity and transportation. Along the X-Axis we see bedload size increasing from micro-fine muds to bedload 100mm in diameter; the Y-Axis shows the velocity in cumecs. There are two important lines within the graph. The lower line is the critical deposition line and if velocity falls below it then bedload will be deposited. The upper line is called the critical erosion line. If velocity reaches this line then the corrosponding bedload size will be eroded (picked up). There are a number of processes to observe. Firstly, it generally requires more velocity to erode bedload than it does to transport it and deposit it. Secondly, the larger the bedload (above 0.1mm) the greater the velocity required to both transport and erode it. Finally, for micro-fine muds, it requires a high velocity; greater than 100 cumecs to actually erode but once picked up by the flow, the river requires very little velocity to continue to transport it. This helps explain why water is often murky brown. Fine sediments are very easily transported through suspension.
