|
|
|
Climate Change Politics (International Response)
Kyoto Protocol 1997
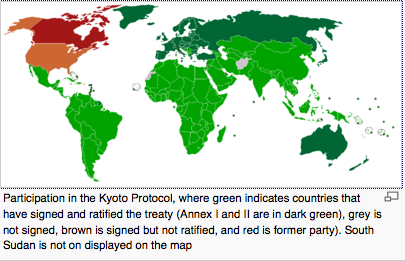
The Kyoto Protocol was the first internationally legal binding target for the reduction of green house gas emissions. It was signed by 168 countries on the 11 December 1997 in Kyoto, Japan. The target was to cut global greenhouse gases by 12.5% based on 1990 levels by the year 2012. It placed the sole emphasis on reduction on developed countries with developing countries, including China and India exempt from any cuts. This Protocol did not become enforced until 2005. The largest undermining factor was the failure of the USA to ratify the protocol. Given that the USA was and still is responsible for approximately a quarter of all green house gases their lack of leadership cannot be underestimated in its detrimental impact on climate talks. President Clinton knew that without agreement to cut significantly, emissions of developing countries' emissions it would not pass the House of Senate vote. Secondly President George W Bush effectively withdrew the USA from the platform of negotiation for two terms of office. He took a sceptical position and on many occasions questioned the evidence for climate changed caused by humans. More recently President Obama despite some positive rhetoric has failed to deliver any leadership in regard to cutting emissions. In fact he almost didn't even turn up at the much anticipated and built-up Copenhagen Conference of 2009. In the end he did fly in for the last day and forged through a weak and accord in partnership with just a few other countries. See this excellent site on the politics of Kyoto at earth organization. The map below shows the number of countries to have signed and/or ratified the Protocol.
The Kyoto Protocol was the first internationally legal binding target for the reduction of green house gas emissions. It was signed by 168 countries on the 11 December 1997 in Kyoto, Japan. The target was to cut global greenhouse gases by 12.5% based on 1990 levels by the year 2012. It placed the sole emphasis on reduction on developed countries with developing countries, including China and India exempt from any cuts. This Protocol did not become enforced until 2005. The largest undermining factor was the failure of the USA to ratify the protocol. Given that the USA was and still is responsible for approximately a quarter of all green house gases their lack of leadership cannot be underestimated in its detrimental impact on climate talks. President Clinton knew that without agreement to cut significantly, emissions of developing countries' emissions it would not pass the House of Senate vote. Secondly President George W Bush effectively withdrew the USA from the platform of negotiation for two terms of office. He took a sceptical position and on many occasions questioned the evidence for climate changed caused by humans. More recently President Obama despite some positive rhetoric has failed to deliver any leadership in regard to cutting emissions. In fact he almost didn't even turn up at the much anticipated and built-up Copenhagen Conference of 2009. In the end he did fly in for the last day and forged through a weak and accord in partnership with just a few other countries. See this excellent site on the politics of Kyoto at earth organization. The map below shows the number of countries to have signed and/or ratified the Protocol.
|
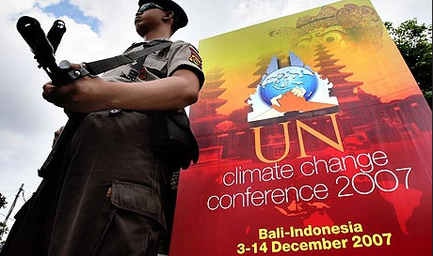
Bali 2007
The Bali Road Map (otherwise known as the Long-term Co-operative Action under the Convention) included a clear agenda for the key issues to be negotiated up to 2009 These issues included:
|
|
|
There were in fact a number of problems in 2007. The US, Japan and Canada were opposed to emissions goals. South Africa called on the US to demonstrate leadership and take their fair share of responsibility. There was also growing conflict in the discussions between the developing world countries and the developed.
There were a number of issues left outstanding after the conference. These included differences on the preambular language of the Bali Roadmap, a description on what should guide developed and developing countries, and the nature of the body that will negotiate the future deal on climate change.
There were a number of issues left outstanding after the conference. These included differences on the preambular language of the Bali Roadmap, a description on what should guide developed and developing countries, and the nature of the body that will negotiate the future deal on climate change.
Copenhagen 2009
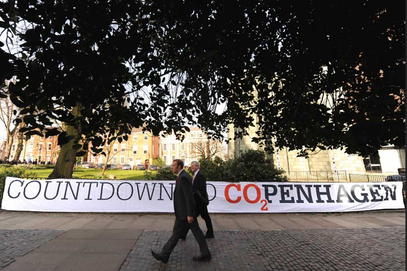
The much awaited Copenhagen Conference had been built up in the years leading to it. Earlier conferences had achieved little and the political rhetoric had been conservative. Talks had been focused on preparing the grounds for decision making at Copenhagen. Environmental groups and activists had also built up their efforts in regard to civic lobbying and public expectation was high. The EU and UK ambitions were high going in to the talks.
The talks however failed to deliver. Countries were clearly seen to be representing their own national interests and prioritising national economic goals ahead of international consensus. Countries, like USA and China as well as the EU were unable to find any type of agreement for much of the 10 day conference. Developing countries felt powerless and at times threatened to walk out. President Obama didn't show up until the last day and probably only arrived because of the failure to reach any agreement in the first place. He failed in many respects to provide the momentum that was so hoped for. He struggled to offer any real leadership in the conference in regard to promised cuts in emissions and didn't approach the issue of passing legislation in the House of Senate. That said, Copenhagen wasn't a complete failure, with the main outcome the Copenhagen Accord.
The Accord, reached between the US, China, India, Brazil and South Africa, in the last hours of the final night in a closed room contained no reference to a legally binding agreement, as some developing countries and climate activists wanted. The accord, which was 'recognised' rather than 'approved' by the 193 nations present at the conference recognised the need to limit global temperatures rising no more than 2°C above pre-industrial levels. The language in the text showed that 2°C was not a formal target, just that the group recognised the scientific view that the temperature increase should be held below this figure.
However, the accord did not identify a year by which carbon emissions should peak. Countries were asked to plan by 1 February of the following year their pledges for curbing carbon emissions by 2020. However there was no reference to penalties and of course these targets were not legally binding.
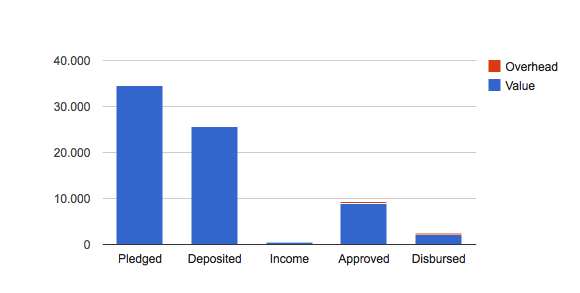
The accord also promised to deliver $30bn of aid for developing nations over the next three years. It outlined a goal of providing $100bn a year by 2020 to help poor countries cope with the impacts of climate change. This fund would become the Green Climate Fund. The accord stated that rich countries would jointly mobilise the $100bn, drawing on a variety of sources: "public and private, bilateral and multilateral, including alternative sources of finance." This fund would support projects in developing countries related to mitigation, adaptation, "capacity building" and technology transfer. There was strong rhetoric from
the UN Secretary General Ban Ki-moon who said that the accord would need to be turned into a legally binding treaty by the following year. The graph below shows the current status (01.02. 2013) of the funding pledged and received in $million. Of the $25 billion dollars over $15 billion has come directly from Japan, almost $5 billion from the UK and just over $6 billion from USA, Germany and Canada combined. Clearly from this narrow group of donors the exact mechanisms for funding remain unclear, and there is also a clear discrepancy between pledged donorship and monies received.
The talks however failed to deliver. Countries were clearly seen to be representing their own national interests and prioritising national economic goals ahead of international consensus. Countries, like USA and China as well as the EU were unable to find any type of agreement for much of the 10 day conference. Developing countries felt powerless and at times threatened to walk out. President Obama didn't show up until the last day and probably only arrived because of the failure to reach any agreement in the first place. He failed in many respects to provide the momentum that was so hoped for. He struggled to offer any real leadership in the conference in regard to promised cuts in emissions and didn't approach the issue of passing legislation in the House of Senate. That said, Copenhagen wasn't a complete failure, with the main outcome the Copenhagen Accord.
The Accord, reached between the US, China, India, Brazil and South Africa, in the last hours of the final night in a closed room contained no reference to a legally binding agreement, as some developing countries and climate activists wanted. The accord, which was 'recognised' rather than 'approved' by the 193 nations present at the conference recognised the need to limit global temperatures rising no more than 2°C above pre-industrial levels. The language in the text showed that 2°C was not a formal target, just that the group recognised the scientific view that the temperature increase should be held below this figure.
However, the accord did not identify a year by which carbon emissions should peak. Countries were asked to plan by 1 February of the following year their pledges for curbing carbon emissions by 2020. However there was no reference to penalties and of course these targets were not legally binding.
The accord also promised to deliver $30bn of aid for developing nations over the next three years. It outlined a goal of providing $100bn a year by 2020 to help poor countries cope with the impacts of climate change. This fund would become the Green Climate Fund. The accord stated that rich countries would jointly mobilise the $100bn, drawing on a variety of sources: "public and private, bilateral and multilateral, including alternative sources of finance." This fund would support projects in developing countries related to mitigation, adaptation, "capacity building" and technology transfer. There was strong rhetoric from
the UN Secretary General Ban Ki-moon who said that the accord would need to be turned into a legally binding treaty by the following year. The graph below shows the current status (01.02. 2013) of the funding pledged and received in $million. Of the $25 billion dollars over $15 billion has come directly from Japan, almost $5 billion from the UK and just over $6 billion from USA, Germany and Canada combined. Clearly from this narrow group of donors the exact mechanisms for funding remain unclear, and there is also a clear discrepancy between pledged donorship and monies received.
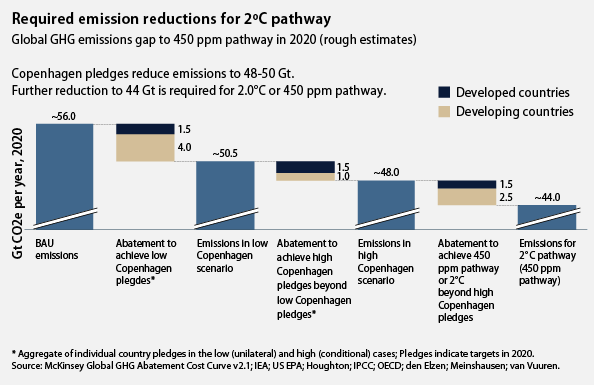
As part of the Copenhagen Accord countries were required to sumbit their pledges for emission reduction before the 'soft' target date of 1 February. In March 2010, Nicholas Stern gave a talk at LSE on the outcome of Copenhagen conference. Stern said that he was disappointed with the outcome of the conference, but saw the Accord as a possible improvement on "business-as-usual" greenhouse gas emissions. In his assessment, to have a reasonable chance of meeting the 2°C target, the preferred emissions level in 2020 would be around 44 gigatons. The voluntary pledges made in the Accord (at that date) would, according to his projection, be above this, nearer to 50 gigatons. In this projection, Stern assumed that countries would fulfil the commitments they had made. Stern compared this projection to a "business-as-usual" emissions path. His estimate of "business-as-usual" suggested that without the Accord, emissions might have been above 50 gigatons in 2020. Of all the Annex I countries committed to making targeted reductions the USA has pledged the lowest of just 17 percent compared to the EU 20-30 percent and Japan's 25 percent.
Durban 2011 and Doha 2012
After two weeks of negotiations at Durban the 195 Parties to the UN climate change convention agreed on a roadmap, proposed by the EU, for drawing up a legal framework by 2015 for climate action by all countries. The success of the Durban rounds was found in the agreement by all countries, including USA, China and India as well as all developing countries to sign up to legally binding targets to cut emissions, which would only come into force by 2020. Prior to 2020 emission cuts would only be voluntary, in line with the Copenhagen pledges.
What remained unclear from this round of talks is the actual scale of ambition to curb global warming, as reflected in the mitigation targets countries adopt. The Durban agreement includes an acknowledgement that there is a widening gap between the mitigation efforts currently promised and those required to keep warming within the broadly recognised 2°C safety limit.
Agreement was also reached in Durban on a package of other climate-friendly additional measures. Most importantly, it included an agreement on the broad design of a global Green Climate Fund, which will funnel some of the $100 billion that developed Annex I countries have promised to make available to developing countries by 2020, to help them cut emissions and adapt to climate change. Again, there was no agreement—and little discussion—on the important question of where the money will be found. At the time business leaders, appeared quite disatisfied by these omissions. “The agreement reached was more of a victory for the UN process, than for the global climate, or in creating a new business imperative,” said Jonathan Grant, head of sustainability and climate change at PwC. “Business will shrug its shoulders over Durban and wait for direction from national capitals.”
Doha 2012
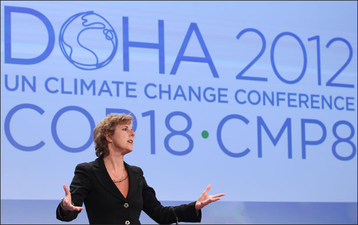
The rhetoric ahead of Doha was that it should be viewed as a stepping-stone to the showdown talks of 2015. But according to the EU Commissioner Connie Hedegaard (above) much more was achieved. A new system where all countries, developed and developing will for the first time make legal commitments under the new global agreement. In addition, the structure of the negotiations changed. For the first time members from both developed and developing countries sat together and negotiated in one forum, the Durban Platform. No longer will there be a distinction between developed countries and developing countries, which always proved very divisive and counterproductive at talks.
The Doha conference also agreed that there would be a second commitment period of the Kyoto Protocol. 37 countries including Australia and the EU members signed the amendment for a second phase. It will run from 1 January 2013 to 31 December. Collectively, these countries will reduce their emissions 18% below their 1990 level between 2013-2020. The Durban conference also made operational the new Green Climate Fund for developing countries.
In addition, the long-running problem of "hot air" – surplus of unused carbon credits from the first Kyoto period was finally resolved. Buyers will now be limited in how much they can purchase. The EU's law doesn't allow using them at all and all potential buyers made declarations that they will not buy them anyway. Finally, the new rules were established preventing the creation of additional hot air loop holes to mitigation.
Furher reading on the outcome of Doha can be read at American progress
What remained unclear from this round of talks is the actual scale of ambition to curb global warming, as reflected in the mitigation targets countries adopt. The Durban agreement includes an acknowledgement that there is a widening gap between the mitigation efforts currently promised and those required to keep warming within the broadly recognised 2°C safety limit.
Agreement was also reached in Durban on a package of other climate-friendly additional measures. Most importantly, it included an agreement on the broad design of a global Green Climate Fund, which will funnel some of the $100 billion that developed Annex I countries have promised to make available to developing countries by 2020, to help them cut emissions and adapt to climate change. Again, there was no agreement—and little discussion—on the important question of where the money will be found. At the time business leaders, appeared quite disatisfied by these omissions. “The agreement reached was more of a victory for the UN process, than for the global climate, or in creating a new business imperative,” said Jonathan Grant, head of sustainability and climate change at PwC. “Business will shrug its shoulders over Durban and wait for direction from national capitals.”
Doha 2012
The rhetoric ahead of Doha was that it should be viewed as a stepping-stone to the showdown talks of 2015. But according to the EU Commissioner Connie Hedegaard (above) much more was achieved. A new system where all countries, developed and developing will for the first time make legal commitments under the new global agreement. In addition, the structure of the negotiations changed. For the first time members from both developed and developing countries sat together and negotiated in one forum, the Durban Platform. No longer will there be a distinction between developed countries and developing countries, which always proved very divisive and counterproductive at talks.
The Doha conference also agreed that there would be a second commitment period of the Kyoto Protocol. 37 countries including Australia and the EU members signed the amendment for a second phase. It will run from 1 January 2013 to 31 December. Collectively, these countries will reduce their emissions 18% below their 1990 level between 2013-2020. The Durban conference also made operational the new Green Climate Fund for developing countries.
In addition, the long-running problem of "hot air" – surplus of unused carbon credits from the first Kyoto period was finally resolved. Buyers will now be limited in how much they can purchase. The EU's law doesn't allow using them at all and all potential buyers made declarations that they will not buy them anyway. Finally, the new rules were established preventing the creation of additional hot air loop holes to mitigation.
Furher reading on the outcome of Doha can be read at American progress
|
|
|
Warsaw 2013
The following articles provide a good summary of the hopes and key questions and issues arising from the Warsaw Conference
The BBC - Last Minute Deal Saves Fractious UN Climate Talks
The Guardian - UN climate Talks in Warsaw: What you need to know
The Guardian - Developing Countries walk out
Guardian article
The BBC - Last Minute Deal Saves Fractious UN Climate Talks
The Guardian - UN climate Talks in Warsaw: What you need to know
The Guardian - Developing Countries walk out
Guardian article
The Climate of the last 20 000 years
Climate change can be defined a significant variation in average atmospheric conditions over two consecutive 30 year periods. It is not represented by a single warmer than average year or a winter of heavy rainfall. It relates only to long term changes in trend.
The last 20 000 years has seen a great deal of variation in climate. We can divide the the last 20 000 years in to two periods. Firstly the the last 10 000 years is called the Holocene and the 10 000 year period before that is called the Pleistocene. The Holocene has been characterised by a great deal of variation including the periods known as the Holocene Climate Optimum, the medieval warm period, the little ice age • and of course in the last two centuries the impacts of the industrial revolution and industrial age.
The last 20 000 years has seen a great deal of variation in climate. We can divide the the last 20 000 years in to two periods. Firstly the the last 10 000 years is called the Holocene and the 10 000 year period before that is called the Pleistocene. The Holocene has been characterised by a great deal of variation including the periods known as the Holocene Climate Optimum, the medieval warm period, the little ice age • and of course in the last two centuries the impacts of the industrial revolution and industrial age.
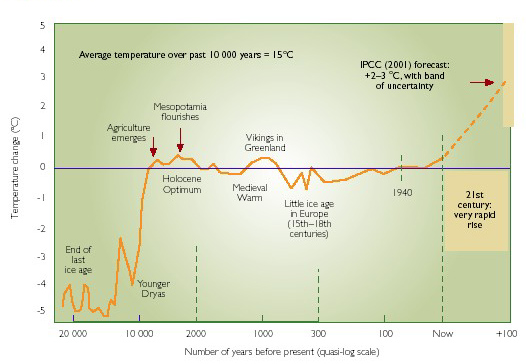
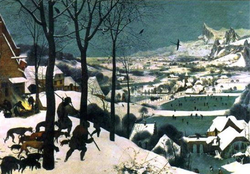
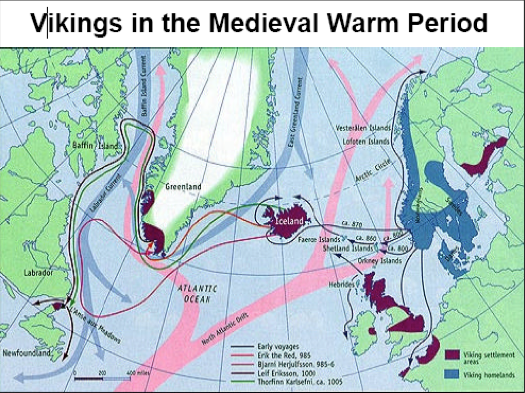
As you can see from the graph above, which uses a quasi-log scale for time. The Pleistocene was dominated by a period of very cold temperature untill around 10 000-9 000 years ago when the world experienced a period of rapid warming of around 4-5 °C. Since the year 10 500 temperature have remained in comparison to the Pleitocene relatively warm. The world average being 15°C. However this is not to say that variation has not occurred. There have been periods of warming that has allowed great steps forward for mankind, such as the agricultural developments and growth of Mesopotamia. At this time food supply advanced due to warmer temperatures, Similarly the Vikings had their great migration in the warm period around 1000AD. Another notable period is the little ice of the 15th to 18th centuries, as depicted in the ice fair paintings of Breugel. However since the 18th Century the world has expericnced a warming that has has now taken us close to the warmest periods of the Holocene and is projected to increase with some uncertainty between 2-3°C over the next 90 years.
|
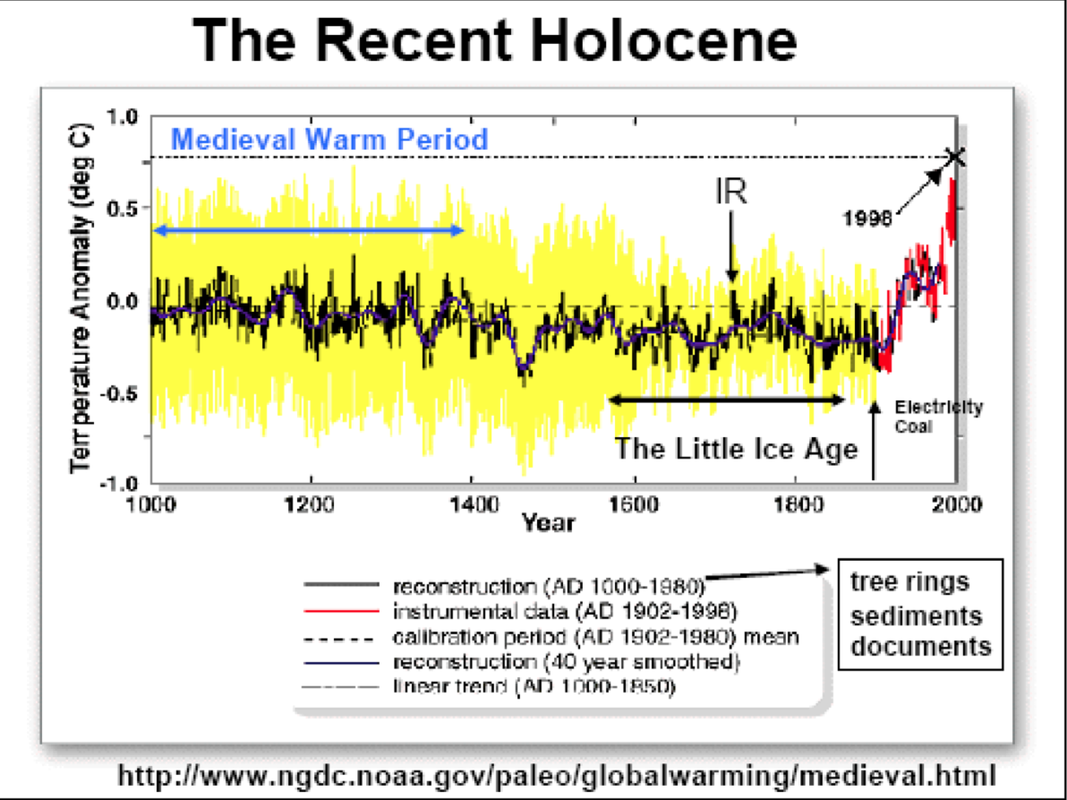
The pre-industrial age is an important period of climate science as it tells us a great deal about natural variations in the climate before the influence of humans. Two periods stand out in the Holocene, the Medieval Warm Period and the Little Ice Age. The Medieval Warm Peiod lasted from 900-1380AD.
European temperature was 0.5-0.8°C warmer than average long term trends. This period coincided with a great deal of growth and change including the Vikings colonizing Greenland and North America, the production of wheat in Norway, successful production of oats and barley in Iceland, vineyards in England. This period ended with extreme weather events like storms and floods and eventually catostrophic food shortages. |
|
The Little Ice Age, which occurred between 1580-1850AD in contrast saw significantly lower than average temperature but it remained highly variable in time and place. It was characterised by a period of advancing glaciers, lowered tree-lines, the freezing of lakes, rivers, canals, sea-ice expansion and population stability if not decline. It was at this time that the population of Iceland was almost wiped out completely. |
|
Explaining Climate over the last 20 000 years
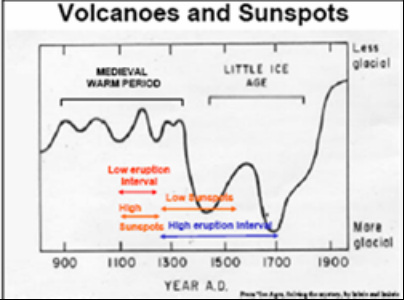
When explaining climate change over the last 20 000 years it is important to make the distinction between the more recent industrial age, which only covers the last 200 years or so and the rest of the rest. Changes within the latter of these two periods can only be explained by natural factors, of which there are a number. These include volcanic activity, sun spot activity and both the precession and orbit of the earth.
Firstly, volcanic activity from large eruption columns inject ash particles and sulfur-rich gases into the troposphere and stratosphere.
These clouds can circle the globe within weeks. The small ash particles decrease the amount of sunlight reaching the surface of the earth and lower average global temperatures. The sulfurous gases combine with water in the atmosphere to form acidic aerosols that also absorb incoming solar radiation and scatter it back out into space.
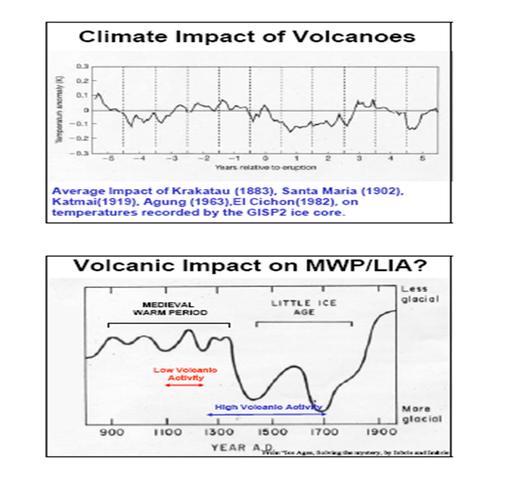
The graphs above show the average impact on temperature of a number of large scale eruptions dating back to Krakatau in 1883. As you can see from the graph temperature falls following large scale eruptions and this can last 2-3 years. The Litttle ice age was characterised by high volcanic activity. A second factor influencing the climate relates to sun spot activity.
|
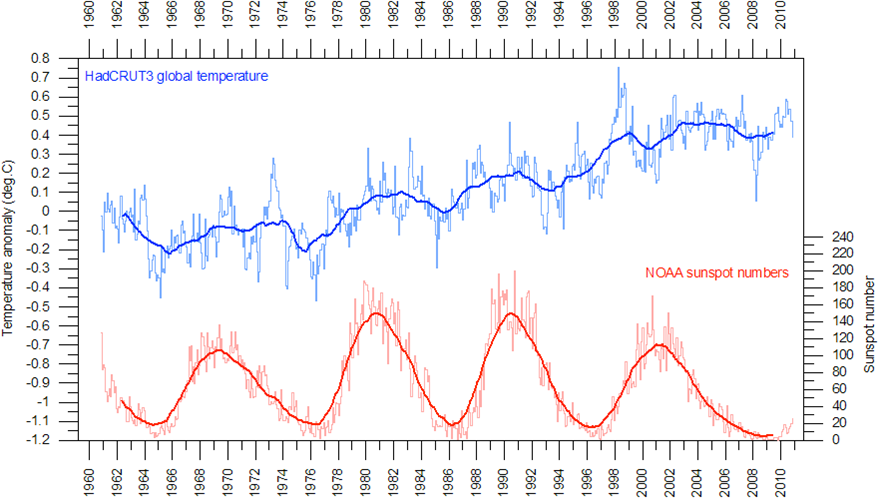
The sun's energy output varies in time and is directly related to the pattern of sun spots on the photosphere of the sun. Sun spots are areas of intense magnetic activity and host secondary phenomena such as solar flares.
Most mass ejections originate in magnetically active regions around visible sunspot groupings. The graph to the left shows that sun spot activity follows a distinct cyclical pattern. Sun spots typically follow 11 and 22 year cycles but also have more long term cyclical patterns. High sun spot activity relates to lower than average atmospheric temperature. Low sunspot activity relates to higher than average atmospheric temperature. This caused by darker sun surfaces inhibiting the solar output. However, sunspots host solar flares and these are considered to overide the influence of sunspots leading to a marginal increase in warming (>0.1°C ). |
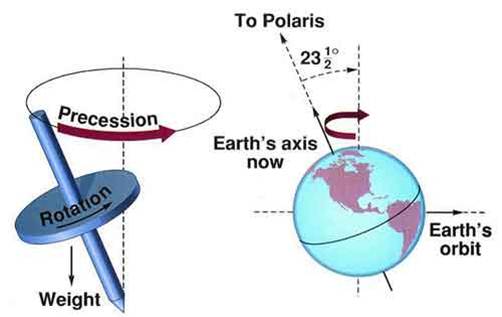
A second natural factor relating to the energy output of the sun relates to how the earth wobbles and the angle of the axis, with respect to the plane of revolution around the sun, which varies between 22.5° and 24.5°. Less of an angle than our current 23.5° means less seasonal differences between the Northern and Southern Hemispheres while a greater angle
means greater seasonal differences (i.e. a warmer summer and cooler winter). When the obliquity is low, the polar regions get less sunlight, cool, and accumulate ice and snow. The total amount of sunlight caught by the earth remains the same. These changes in axis tilt and wobble oocur on timescale of 41 000 and 21 000 years respectively.
means greater seasonal differences (i.e. a warmer summer and cooler winter). When the obliquity is low, the polar regions get less sunlight, cool, and accumulate ice and snow. The total amount of sunlight caught by the earth remains the same. These changes in axis tilt and wobble oocur on timescale of 41 000 and 21 000 years respectively.
A major factor influencing Earth's climate is
eccentricity. Eccentricity is the change in the shape of the earth's orbit around the sun. Currently, the planet's orbit is almost a perfect circle: the present eccentricity is 0.017. Changes in the earth's orbit brings us either closer or further away from the sun. To be precise there only a 6 percent difference and ranges from 91.4 million miles away from the sun to 94.5 million miles from the sun. This cyclical pattern operates on a cycle of roughly 95 000 years. This change in orbit is responsible for signifcant periods of global cooling where the temperature has fallen 5-6°C lower than today's temperature and risen during the inter-glacial periods 2-3°C warmer than today. This pattern can be seen in the graph above. |
|
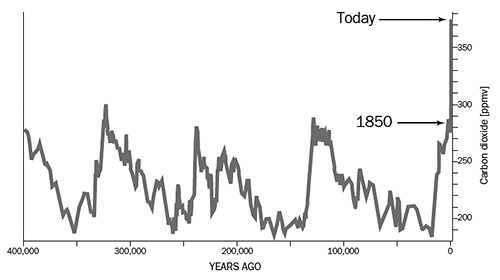
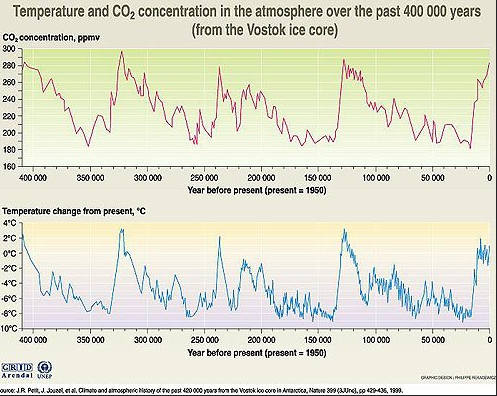
One final factor to consider, in regard to climates change is the role of oceans. Over short time periods the sourthern ocean oscillations shift resulting in dramatic changes in climate and weather. This phenomina is more commonly known as El Nina and with climate change there appears to be some evidence of the frequency of El Nina increasing. Over longer time scales the carbon sequestration has a major impact. During ice ages CO2 levels decrease to ~180 ppmv, and much of this is believed to be stored in the oceans. As ice ages end, CO2 is released from the oceans and CO2 levels during previous interglacials have been around ~280 ppmv. Oceans currently take up a third of the carbon emitted by human activity, roughly two billion metric tons each year.
The Industrial Age
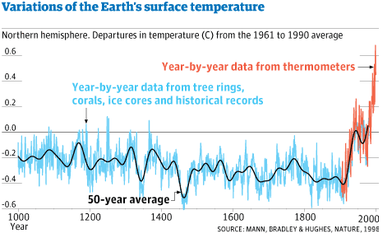
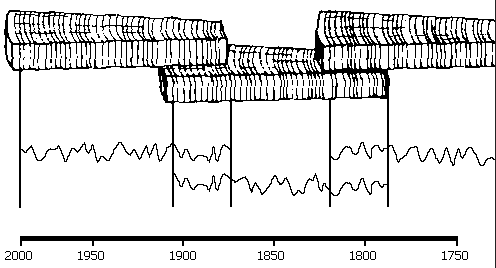
The infamous hockey stick graph to the left shows a remarkable change in temperature since 1900 with average global temperature rising 0.6°C above the long term average and year-by year data showing a full 1°C rise. The graph is compiled by strong proxy data from a combination of tree rings, corals and ice cores and modern data is attained direct from thermometers. The graph's remarkable growth shows a stunning visual of global warming and has been a key instrument for the IPCC in their efforts to argue a case for man-made warming. When overlayed with natural causes and green house gas emissions like that shown in the video below it makes a compelling argument for man-made causes of global warming.
The Greenhouse Effect and the Enhanced Greenhouse Effect
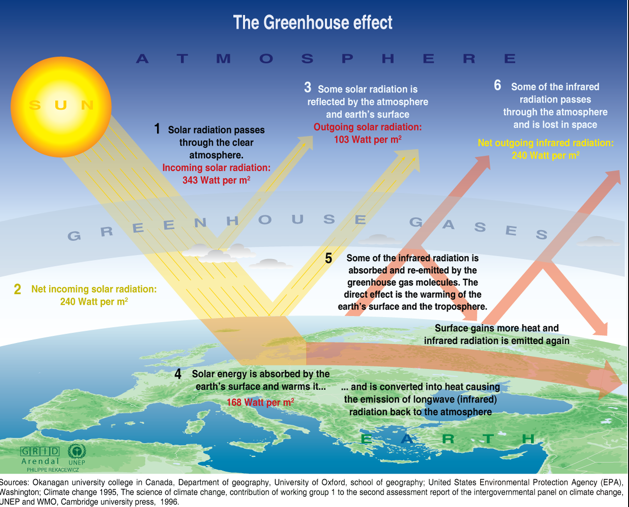
The exact mechanisms of the greenhouse effect is illustrated and explained in detail in the diagram to the left. This process is a naturally occuring phenomina in the atmosphere and without it our atmoshere and planet would be frigid and uninhabitable by humans. It is a natural process that helps regulate and stabilise our temperature. Despite this there are long term and short term variations in the amount of greenhouse gases in the atmosphere that create natural fluctuations in atmospheric temperature. The enhanced greenhouse effect is caused by an increase in the amount of greenhouse gases mainly CO2 that increases the warming effect. In short humans through fossil fuel based energy are seen to be warming the atmosphere. This phenomenon is unprecidented in all of human history. There has been much debate about the exact realtionship between CO2 and temperature rise. In many cases temperature increase has proceeded C02 and equally CO2 has led to and increase in atmospheric temperature. Many climate sceptics in the media and on blogging sites make frequent reference to an 800 year lag time revealed in the Vostok ice core. This is well known data and shows CO2 to lag behind temperature. This is very well explained and critiqued in the second of Peter Hadfield's videos below, but in short can be explained by positive feedback prosesses whereby CO2 is increased in the atmosphere by a natural phenomina such as changes in the Earth's orbit and tilt. This increase CO2 in the atmosphere is caused by reducing CO2 sequestration in the ocean. This extra CO2 in the atmosphere has the knock-on effect of increasing temperature.
What appears to be happening in the case of modern-day global warming is that the increase in CO2 is in fact being caused by humans and the knock-on effect is warming of the atmosphere through the enhanced greenhouse effect. The broader concern is that this warming could lead to further reductions in carbon sequestration in the oceans and permafrost regions tand that this release of greenhouse gases in turn causes further warming. In this case the potential catestrophic event of run-away-global warming would essentially have its route cause from human activity. An example of feedback can be seen in Ian Stewat's video on Climate Change. He demonstrates how the melting permafrost has the potential to release an enormous amount of methane into the atmopshere. The result could be a run-away climate change event.
The Inconvenient Truth's cartoon explanation of the greenhouse effect is also quite entertaining!
|
|
|
It is important to recognise that there is a debate among scientists over the causes and expected severity of recent global warming. However, this is a debate that is often misrepresented in the media and by polticians, particuarly politicians whose interests are with the corporate energy giants. This is most noteable in the USA where any loyal Republican is required by default to question the science of climate change and cloud the discussion with any number of false claims. In an age of ubiquitous blogging the debate has become very difficult one to control. The real debate is not about whether humans are causing global warming; despite a handful of scientists who have a sceptical stance on the cause, over 98 percent of all publishing scientists are proponents for man-made global warming (despite the huge financial incentives for research that may argue to the contrary). The real debate is actually about the exact mechanisms of how greenhouse gases are interacting within the complexity of the atmosphere/biosphere and oceans and it also concerns the uncertainty of projected increases in temperature.
It think it's really important that when you study the science of climate change you focus on the scientific facts rather than the general media debate. The following videos produced by Peter Hadfield to counter the media debacle of climate change are highly recommended.
It think it's really important that when you study the science of climate change you focus on the scientific facts rather than the general media debate. The following videos produced by Peter Hadfield to counter the media debacle of climate change are highly recommended.
|
|
|
|
|
|
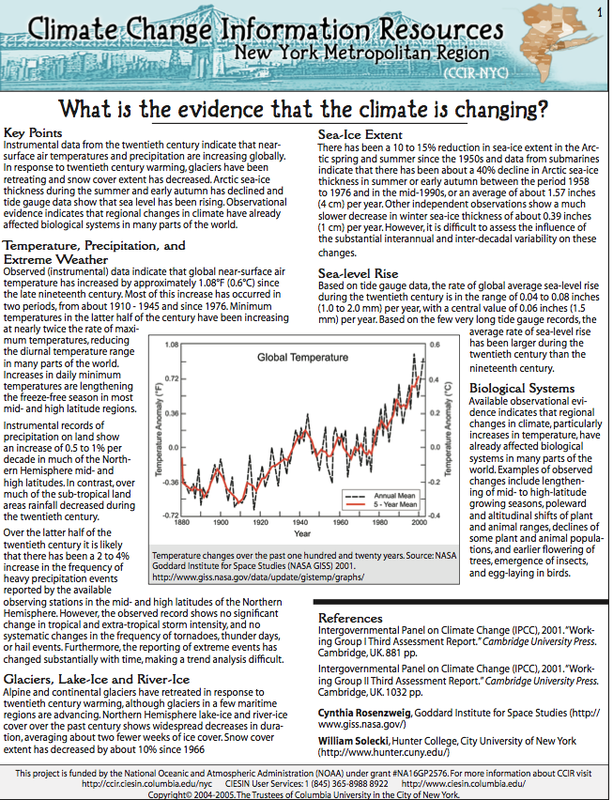
The Evidence of Climate Change
We have been measuring surface temperature for a couple of centuries and the data is now highly reliable and shows that our temperature has increased by more than 0.6ºC over the last 100 years. According to NASA all three major global surface temperature reconstructions show that Earth has warmed since 1880. Most of this warming has occurred since the 1970s, with the 20 warmest years having occurred since 1981 and with all 10 of the warmest years occurring in the past 12 years. Even though the 2000s witnessed a solar output decline resulting in an unusually deep solar minimum in 2007-2009, surface temperatures continue to increase. In addition to temperature data there is a mass of other data being compiled which shows that the climate is warming. Click on the image below from NASA to read the physical evidence for climate change.
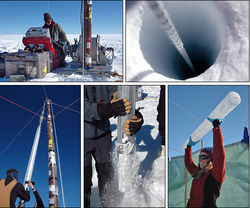
Proxy Data Evidence
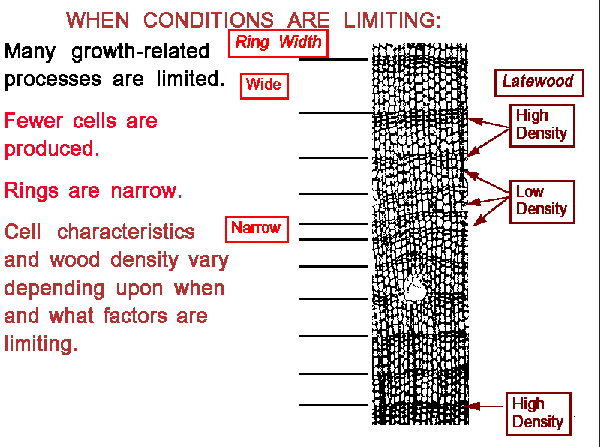
Tree ring data (dendrochronology) can yield information on seasonal temperature and wet or dry conditions. At best, tree rings are comparable to instrumental averages. However, suitable tree species are limited to parts of the temperate latitudes, and many trees need to be sampled and carefully assessed for good results. Even so, tree ring records are only useful for studying regional climates.
|
|
Corals can extract good data on water temperatures through isotopic techniques, although changes in ocean salinity may affect it. Whereas tree rings can be used to construct records thousands of years back, coral chronologies are much shorter and therefore limited in their value. Corals have hard calcium carbonate (CaCO3) skeletons. Some corals form annual rings of calcium carbonate as they grow. Like tree rings these can be used to estimate temperatures. When sea temperature is warm the coral will grow faster than if the temperature is cold, so warmer years will make wider growth rings and colder years will create thinner rings. Isotopes of oxygen contained in the calcium carbonate can also be used to estimate the temperature of the water when the coral grew.
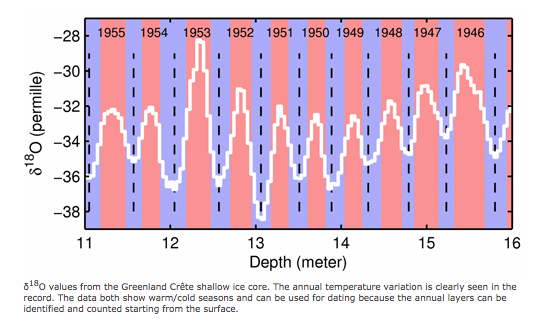
Ice cores show several different kinds of information: air temperature, precipitation, volcanic dust and sulfates, cosmic isotopes created by solar activity, and greenhouse gases in trapped air bubbles. Unfortunately glaciers cover a small portion of the Earth's surface and so only reflect atmospheric conditions for those regions. Perhaps the most important technique associated with ice core research is the measurement of the isotopic composition of water. In brief, the ratio of two oxygen isotopes (18O and 16O) in the rain and snow that falls in temperate and polar regions depends on temperature. By measuring changes in the 18O/16O ratio in the ice through time, researchers can infer the temperature at the time when the snow fell. Thus, climate scientists have reconstructed many snapshots of how temperature (and many other parameters) changed year-to-year. By linking these different types of evidence together, climate scientists are developing a comprehensive view of how climate has varied in the past.
Ice cores show several different kinds of information: air temperature, precipitation, volcanic dust and sulfates, cosmic isotopes created by solar activity, and greenhouse gases in trapped air bubbles. Unfortunately glaciers cover a small portion of the Earth's surface and so only reflect atmospheric conditions for those regions. Perhaps the most important technique associated with ice core research is the measurement of the isotopic composition of water. In brief, the ratio of two oxygen isotopes (18O and 16O) in the rain and snow that falls in temperate and polar regions depends on temperature. By measuring changes in the 18O/16O ratio in the ice through time, researchers can infer the temperature at the time when the snow fell. Thus, climate scientists have reconstructed many snapshots of how temperature (and many other parameters) changed year-to-year. By linking these different types of evidence together, climate scientists are developing a comprehensive view of how climate has varied in the past.
Other lesser proxies include cavestone formations (speleothems) and the annual sediment layers, called varves, found in high-latitude lakes and some places in the ocean. Rivers continuously wash mud and sand from the land into lakes, seas, and oceans, where it settles to form layers of sediment. Cores drilled into these sediments reveal small fossils and chemicals that can help in the interpretation of past climates. Pollen grains are particularly useful. They are very tough, so are often well preserved in sediment layers. Each type of plant produces a different shape of pollen grain. Analysis of pollen grains can reveal what types of plants were growing nearby, and so indicate what the climate would have been like.
When climatologists combine all proxy data a very compelling picture emerges to show how climate has changed. Proxy data has allowed us to evidence climate data going some 400 000 years. the graph below shows the data taken from the Vostok ice core in Greenland.
When climatologists combine all proxy data a very compelling picture emerges to show how climate has changed. Proxy data has allowed us to evidence climate data going some 400 000 years. the graph below shows the data taken from the Vostok ice core in Greenland.
The two videos are useful to watch. BBC's Earth Climate Wars explains ice cores from 42 minutes.
|
|
|