|
|
|
Climate Controls
The Structure of the Atmosphere
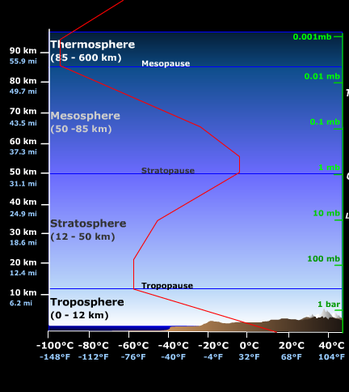
The Atmosphere can be divided into layers according to major changes in temperature. Due to the force of gravity most of the earth's gases, in fact 99% can be found in the botom 32km.
The Troposphere is 0 to 12 km and contains 75% of the gases in the atmosphere. This is the most unstable of layers and where our weather occurs. As height increases, temperature decreases. The temperature drops about 6.5 degrees celsius for every kilometer above the earth's surface. However, this is an average and significantly varies from place to place.
The Tropopause is a thin band located at the top of the troposphere that separates the troposphere from the stratosphere. The temperature remains fairly constant here. It is within the tropopause that we find the jet stream.
The stratosphere is 12 to 50 km. The temperature remains fairly constant (-60 degrees Celsius) in the lower part of stratopshere. This is largely because of ozone. Ozone absorbs ultraviolet radiation from the sun and this causes a temperature increase in the upper part of the layer.
The Stratopause is again a thin layer of homogenous atmosphere that separates the stratosphere from the mesosphere
The mesosphere is 50 to 80 km. This is the coldest region of the atmosphere as the temperature drops in this layer to about -100 degrees celsius. It is this layer of the atmosphere where meteorites burn up on entry. At the top of the mesosphere is the uniform mesopause.
The thermosphere begins at 80 km and extends to many hundreds of kilometers up. The air is very thin. Meaning "heat sphere", the temperature is very high in this layer because ultraviolet radiation is absorbed and turned into heat by ozone and other gases elements. Temperatures often reach 2000 degrees celsius or more. This layer can be further subdivided into:
- Ionosphere - This is the lower part of the thermosphere, extending from about 80 to 550 km. Gas particles absorb ultraviolet and X-ray radiation from the sun. The particles of gas become electrically charged (ions). Here, radio waves are bounced off the ions and reflect waves back to earth. This generally helps radio communication.
- Exosphere - the upper part of the thermosphere. It extends from about 550 km for thousands of kilometers. The air is very thin here and this is the area where satellites orbit the earth.
www.geocraft.com
Incoming Solar Radiation
There are many different data sets available explaining how the process of insolation works. Insolation is derived from the words, Incoming Solar Radiation and refers to the amount of measured radiation received by the surface of the earth.
Insolation is equal to the solar constant, less the amount absorbed, reflected and scattered out by the atmosphere. The solar constant refers to the amount of incoming electromagnetic radiation per unit area. The solar constant remains fairly contant in time but does vary slightly. Scientists have observed 11 year cycles of sun spot activity. In periods of increased sun spot activity the solar constant rises. In periods of reduced sun spot activity the solar constant falls. Over larger time frames the solar constant varies due to changes in the earth eliptical orbit around the sun and through changes in the angle of tilt in its axis. It is these changes that are responsible for the periodic ice ages. In addition, scientists understand the earth to wobble as it spins on its axis. All these factors occcur over large time scales and increase or decrease the solar constant.
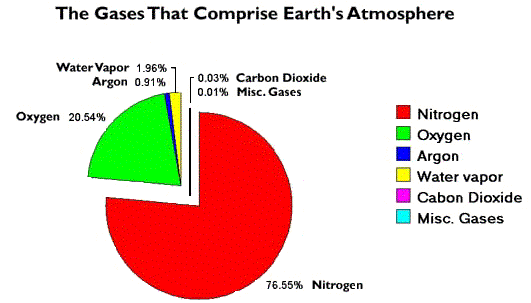
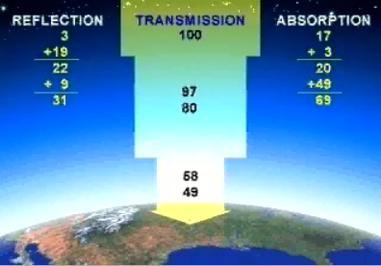
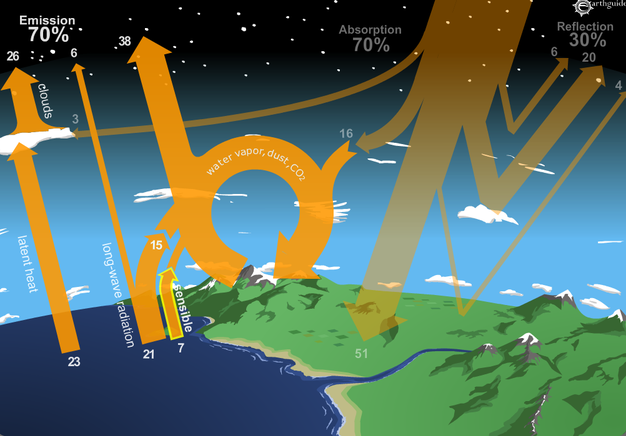
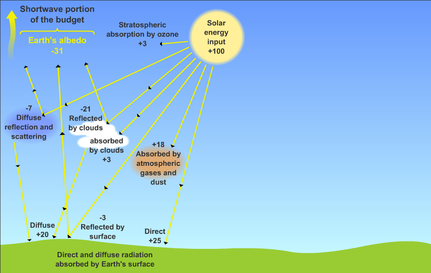
In short, as incoming electromagnetic radiation enters the atmposphere in the form of short wave ultraviolet light it interacts with atmospheric elements. Roughly, 50 percent of radiation reaches the surface as insolation. The rest is either reflected and scattered back to space through its interaction with clouds, water vapour, dust and pollen, known collectively as aerosols or it is absorbed by clouds and gaseous elements and hence heats the atmosphere. Once receiving insolation the surface of the earth warms up, heats the atmosphere around it through sensible heat, latent heat and the release of long wave radiation. The following animations show this interaction.
Insolation is equal to the solar constant, less the amount absorbed, reflected and scattered out by the atmosphere. The solar constant refers to the amount of incoming electromagnetic radiation per unit area. The solar constant remains fairly contant in time but does vary slightly. Scientists have observed 11 year cycles of sun spot activity. In periods of increased sun spot activity the solar constant rises. In periods of reduced sun spot activity the solar constant falls. Over larger time frames the solar constant varies due to changes in the earth eliptical orbit around the sun and through changes in the angle of tilt in its axis. It is these changes that are responsible for the periodic ice ages. In addition, scientists understand the earth to wobble as it spins on its axis. All these factors occcur over large time scales and increase or decrease the solar constant.
In short, as incoming electromagnetic radiation enters the atmposphere in the form of short wave ultraviolet light it interacts with atmospheric elements. Roughly, 50 percent of radiation reaches the surface as insolation. The rest is either reflected and scattered back to space through its interaction with clouds, water vapour, dust and pollen, known collectively as aerosols or it is absorbed by clouds and gaseous elements and hence heats the atmosphere. Once receiving insolation the surface of the earth warms up, heats the atmosphere around it through sensible heat, latent heat and the release of long wave radiation. The following animations show this interaction.
|
|
The Atmospheric Heat Budget
The Global Heat Budget
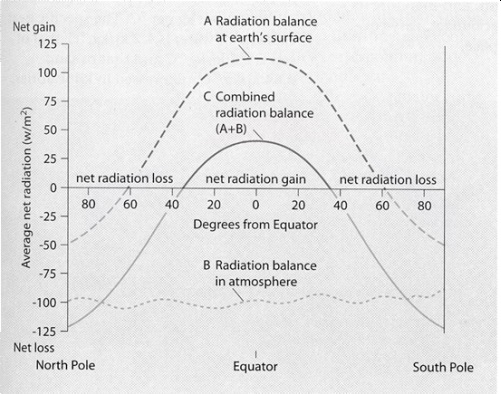
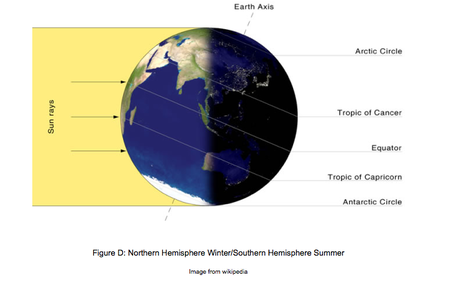
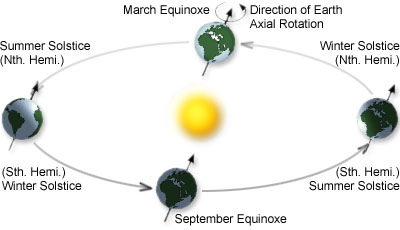
The graph to the left shows the global heat budget. It shows that insolation reaching the Earth's surface is concentrated in the tropics. In the tropical region there is a net heat gain. In contrast, the polar regions are said to have a net heat loss. The reason for this disparity is due to the altitude of the sun and latitude. In the tropics the altitude of the sun is highest and so insolation is more concentrated. In polar regions due to the low angle of the sun, insolation is spreadout over a larger area due to a lower angle of incidence. In addition due to this angle incoming electromagnetic radiation has to travel through more atmosphere. As a result, more radiation is absorbed or reflected back into space. The position of the sun, relative to the Earth varies in time. Due to the Earth's rotation, we experience day and night and due to Earth's eliptical orbit around the sun and axial tilt the sun's relative position to Earth and hence altitude in the sky varies throughout the year. It is this change in altitude that causes the seasonal changes outside the tropics.
|
|
Albedo
Source: Pearson Publications
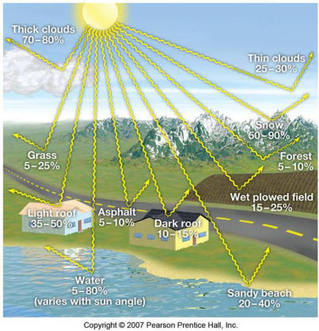
Albedo refers to the amount of insolation reflected back from the surface and varies from surface to surface. Albedo is stated as a percentage. The surface with highest albedo is ice and snow. This shining surface is able to reflect up to 90 percent of insolation. Light roofs also have high albedo as well as water. Surface with lowest albedo are asphalt or tarmac roads and dark roofed buildings. With all surface there is significant range to consider. This is reflected by the situtation of the surface relative to the altitude of the sun.
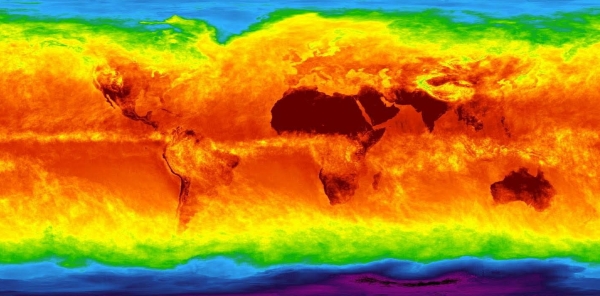
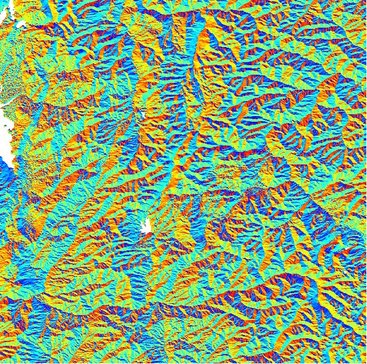
The two factors of altitude of the sun and albedo operate largely together to determine the overall insolation absorbed at the surface. Rather than a uniform 50 percent absorption of insolation, as the animations above show, the pattern at the surface is rather more complex. There is a significant differences between land and sea for example. Due to a combination of albedo and thermal capacity, sea temperatures take much longer periods of time to absorb and transfer heat in comparison to land surfaces. The world map below shows the distribution of insolation world wide. The map of Europe shows the insolation gradient in the direction of the Mediterranean. One important factor of Albedo that relates to climate change concerns the loss of ice sheets in our polar regions. As ice melts and turns into darker ocean surfaces albedo is reduced. This can be seen in the NASA animation below.
The two factors of altitude of the sun and albedo operate largely together to determine the overall insolation absorbed at the surface. Rather than a uniform 50 percent absorption of insolation, as the animations above show, the pattern at the surface is rather more complex. There is a significant differences between land and sea for example. Due to a combination of albedo and thermal capacity, sea temperatures take much longer periods of time to absorb and transfer heat in comparison to land surfaces. The world map below shows the distribution of insolation world wide. The map of Europe shows the insolation gradient in the direction of the Mediterranean. One important factor of Albedo that relates to climate change concerns the loss of ice sheets in our polar regions. As ice melts and turns into darker ocean surfaces albedo is reduced. This can be seen in the NASA animation below.
Source: NASA
|
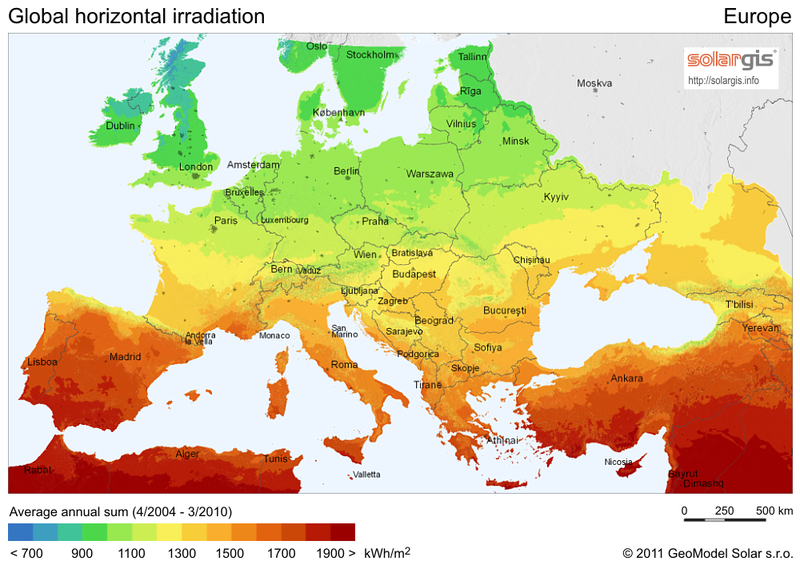
Source: 2011 GeoModel Solar
|
Aspect
Source: research.dmsolutions.ca
Insolation is largely influenced by the positioning of the sun in relation to Earth and insolation should be assessed in regard to both spatial and temporal scales. At the largest spatial scale, the planetary scale, you should understand that the surface of the Earth absorbs a varying amount of insolation. Changes in the Earth's orbit takes the planet closer or further away from the sun. Moreover, its tilt of axis changes over time and its spin creates a wobble effect. All these factors influence insolation but because of the time scale they are unlikely to influence the amount of insolation that we experience in our life time. In addition, the sun also follows an 11 year cycle of sun spot activty, reduced activity leads to lower insolation, an increased cycle leads to fall in insolation.
However, the largest determining factor for us relates to the altitude of the sun. The altitude of the sun also impacts insolation at varying time scale. Firstly, diurnal variation refers to hourly or daily changed observed, e.g. day and night changes in insolation. Secondly, seasonal variation due to the Earth's orbit around the sun has a more significant impact on insolation in more northern latitudes in contrast with tropical latitudes. Belgium summers are warmer because the sun has a higher altitude, our winters are colder because the sun is low in the sky. One other local factor that can play a role and has significant impact on the Geography of place and the Geography of difference is aspect. Aspect refers to the alignment of the land in relation to the sun. In regard to insolation, south facing slopes in the northern hemisphere and north facing slopes in the sourthern hemisphere are warmer than their counterparts. This is because they spend a longer period of time in direct contact with the sun's radiation. Aspect doesn't determine global patterns but is significant in human choices of settlement as well as in regard to our food supply and so in synoptic sense it is important to refer to.
However, the largest determining factor for us relates to the altitude of the sun. The altitude of the sun also impacts insolation at varying time scale. Firstly, diurnal variation refers to hourly or daily changed observed, e.g. day and night changes in insolation. Secondly, seasonal variation due to the Earth's orbit around the sun has a more significant impact on insolation in more northern latitudes in contrast with tropical latitudes. Belgium summers are warmer because the sun has a higher altitude, our winters are colder because the sun is low in the sky. One other local factor that can play a role and has significant impact on the Geography of place and the Geography of difference is aspect. Aspect refers to the alignment of the land in relation to the sun. In regard to insolation, south facing slopes in the northern hemisphere and north facing slopes in the sourthern hemisphere are warmer than their counterparts. This is because they spend a longer period of time in direct contact with the sun's radiation. Aspect doesn't determine global patterns but is significant in human choices of settlement as well as in regard to our food supply and so in synoptic sense it is important to refer to.
Atmospheric Circulation
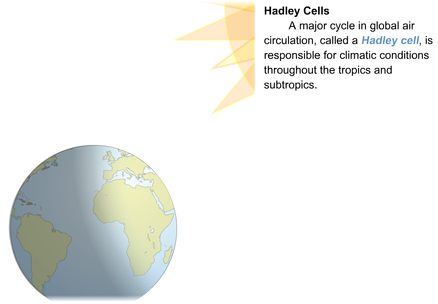
Animation: Hadeley cell
Source: HMX Earth Science
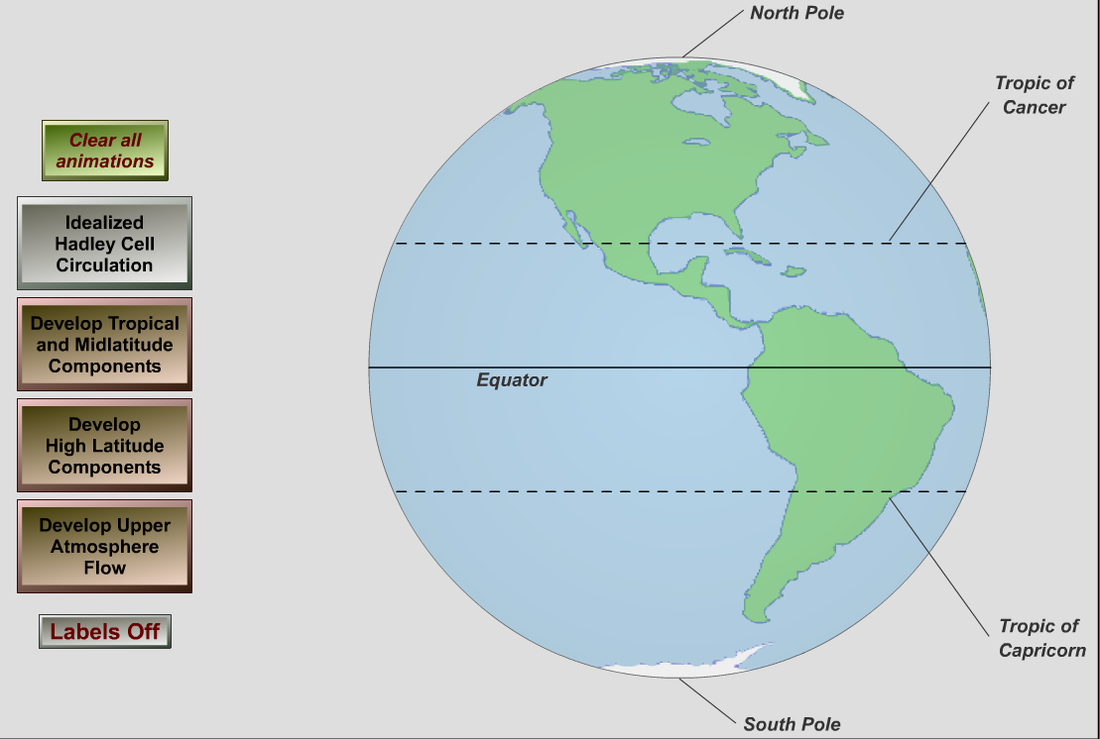
Due to irregular patterns of insolation absorbed at the Earth's surface the planet needs to transfer heat. If heat transfers did not occur, the equator would continually heat up and the polar regions would continually cool. The planet would almost certainly be uninhabitable. Heat transfers occur in a number of ways but can be broadly classified into two main types, atmospheric circulation and oceanic circulation. Atmospheric circulation involves vertical and horizontal air circulation and can be conceptually understood as a convection cell with vertical movements of air upwards and downwards and horizontal movements of air, more comminly known as surface winds. The reality of this is actually far more complex. It is generally considered that there are thre large convectional cells transfering air globally. This isknown as the tricellular model, but even this is an oversimplification. By clicking on the image above you can follow the animation that explains why the world experiences atmospheric circulation.
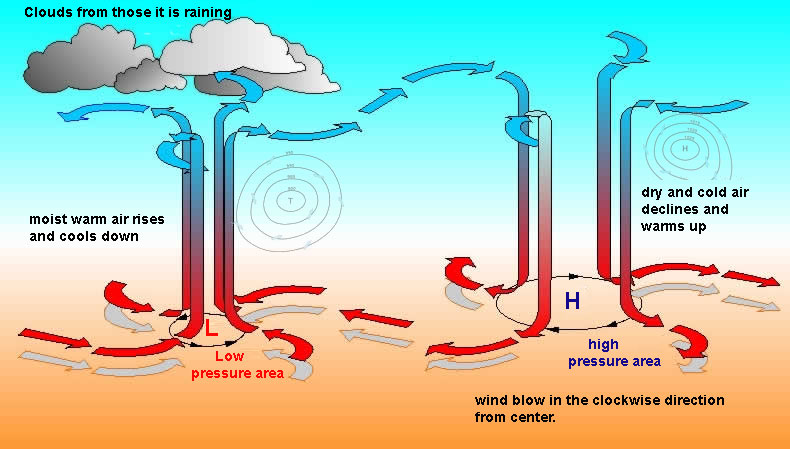
To understand atmospheric circulation you must first understand what we mean by high and low pressure. An area of high pressure is experiencing vertical air circulation downwards over a given area. Effectivley, a given parcel of air is being compressed by falling air above it and this causes surface winds to move away from high pressure.
To understand atmospheric circulation you must first understand what we mean by high and low pressure. An area of high pressure is experiencing vertical air circulation downwards over a given area. Effectivley, a given parcel of air is being compressed by falling air above it and this causes surface winds to move away from high pressure.
|
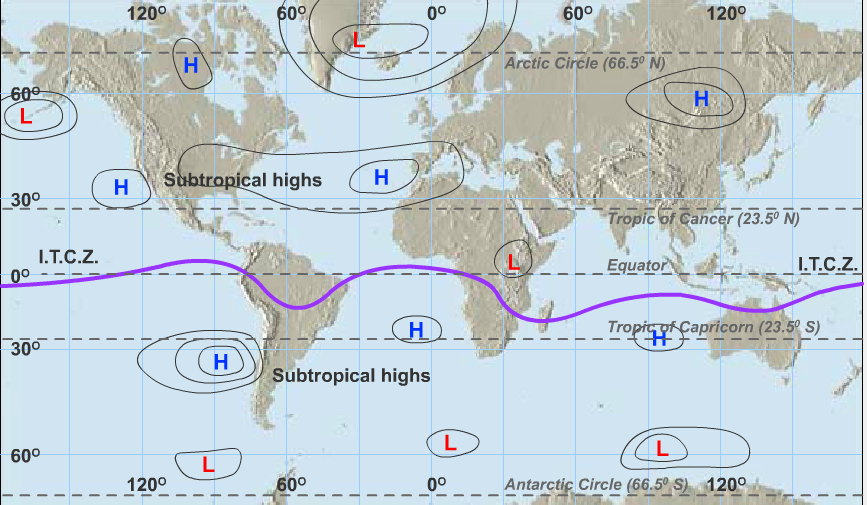
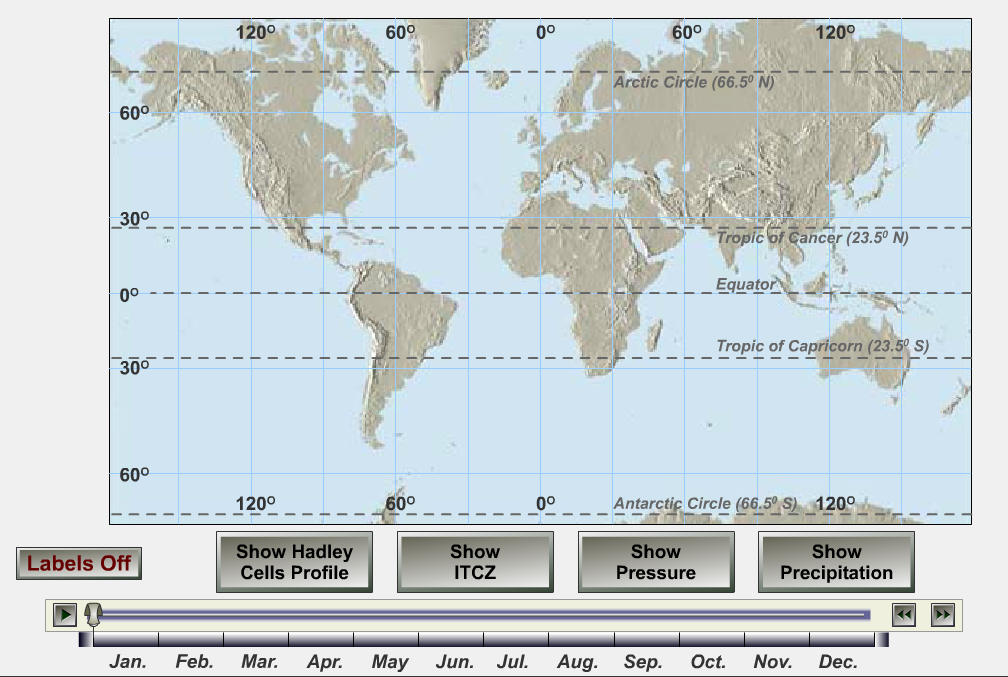
Low pressure is experiencing the opposite, air is moving upwards within the parcel of air. Effectively this means that there is free space at the surface so winds rush in fill that space. Due to the tricelluar model the globe has a distinct pattern of bands of low and high pressure. This can be seen in the map below. The most distinctive band of low pressure is the ITCZ, Inter-Tropical-Convergent Zone, which snakes its way along the tropics but marks the line of greatest insolation and is strongly linked to the altitude of the sun.
|
Source: Physik, Uni - München
|
Source: Paloma Education
In the diagram to the right we can see that over the ITCZ, air is rising. This rising air is a direct result of the heating of air by the high altitude of the sun. As air is heated it vibrates and expands,. As it expands it becomes lighter and begins to rise. This convectional process of rising air over the ITCZ creates the familiar pattern of tropical rain. As air rises it cools adiabatically and condenses to produce towering cumulonimbus rain clouds. In addition, it forms an extended area of low pressure. This is further explained in the video tutorial below.
|
|

Because the air has heated and remains warmer than the air around it, air continues to rise and as it rises it cools, untill it reaches the tropopause at about 12km. At this point it can rise no further, because its temperature is now cold (approximately -50°C) and consistent with the temperature of the upper troposphere and tropopause around it. Due to continued rising air below it the cold air is forced to the south and north. As it moves away from the ITCZ it experiences radiationally cooling and begins to slowly sink. As the air sinks it warms and its relative humidity (the amount of water vapour in the air at any given time) falls. Effectively, this means that water vapour through the sinking and warming process becomes locked inside the air. The resulting landforms of this sinking air are the great deserts located at 30 degrees north and south. This convection cell is known as the Hadley Cell and through its circulation heat is transferred from the equator to the latitudes of 30°. From there, air is either returned back to the equator via trade winds or moved further north or south via the westerlies, where its forms part of the Ferrel Cell. The trade winds and westerlies represent horizontal transfers of air and the direction is governed by two factors. Firstly, that surface winds move from bands of high pressure to bands of low pressure and secondly, that air is deflected by the rotation of the Earth. A deflection called the coriolis effect. The coriolis effect is superbly explained in the video below, produced by graduate students from the University of Illinois.
Source: Paloma Education
|
Source: UK Divers
|
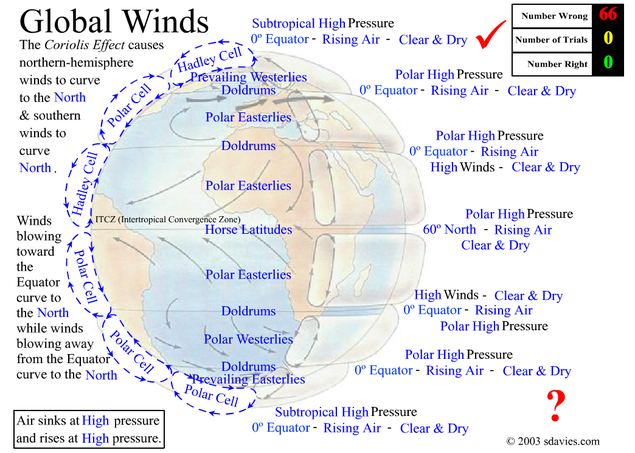
Test your knowledge of atmospheric circulation with this interactive model. All the correct terms are jumbled up, by clicking on them you get to test your knowledge. Thanks go to S. Davies. Just click on the link.
|
|
Ocean Circulation
Source: Windows to the Universe
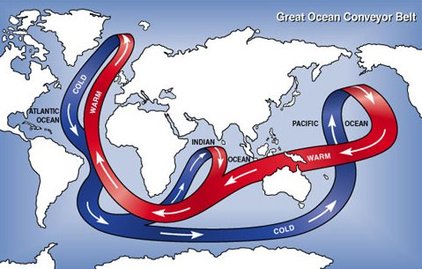
A second major transfer of heat involves ocean circulation. Oceans can be described as heat reservoirs due to their thermal capacity to retain heat over long periods of time, but they also have a more important role as transfers of heat. In order to redistribute heat from the tropics and cold from the polar regions ocean currents transfer warm and cold waters via the thermohaline ocean circulation
The thermohaline ocean circulation , sometimes called the coneyor belt is a massive uninterupted current of moving warm and cold water. The main driving mechanism of this ocean circulation is related to density differences of warm and cold water. Cold water is generally denser than warm water.
The thermohaline ocean circulation , sometimes called the coneyor belt is a massive uninterupted current of moving warm and cold water. The main driving mechanism of this ocean circulation is related to density differences of warm and cold water. Cold water is generally denser than warm water.
|
However, salt also makes the polar water denser. At high latitudes a combination of factors cause the water to increase in density. Cold wind blows over the water and and this increases rates of evaporation, but also increases the depth of cold water. Sea ice locks out salt in a process called brine exclusion, making the ice freshwater based and at the same time causing the sea water below to increase in salinity and density and sink. The Thermohaline circulation connects warm surface currents with deep ocean cold currents and transfers heat across all the major oceans. In total, it takes up to 1000 years for water to make the full journey.
|
Source: Indiana Education
|
|
|
Video: Courtesy of NASA and Windows to the Universe
|
Just as rivers on land flow down hill towards the sea, deep density-driven currents in the oceans move along submarine valleys towards the deepest parts of the ocean. This is superbly shown in the two videos above.
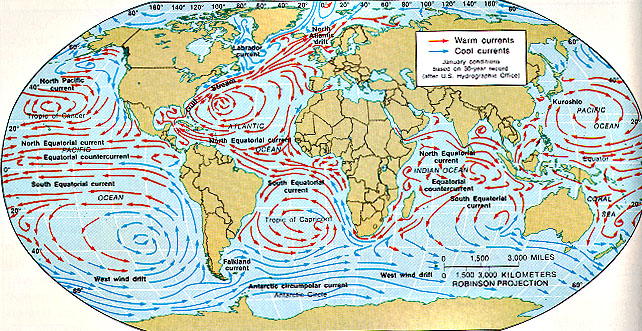
In addition, to the thermohaline circulation there are many other ocean currents. Their pattern can be seen in the map above by Indiana Education. This complex pattern is the result of many interactions related mainly to prevailing winds, such as the subtropical trade winds and the prevailing westerlies. These winds create surface currents of water and as result also transfer heat away from the tropics. The pattern is more complex in places due to the interaction with coastal and submarine topography.
In addition, to the thermohaline circulation there are many other ocean currents. Their pattern can be seen in the map above by Indiana Education. This complex pattern is the result of many interactions related mainly to prevailing winds, such as the subtropical trade winds and the prevailing westerlies. These winds create surface currents of water and as result also transfer heat away from the tropics. The pattern is more complex in places due to the interaction with coastal and submarine topography.
Land and Sea
Source: Ocean service, NOAA
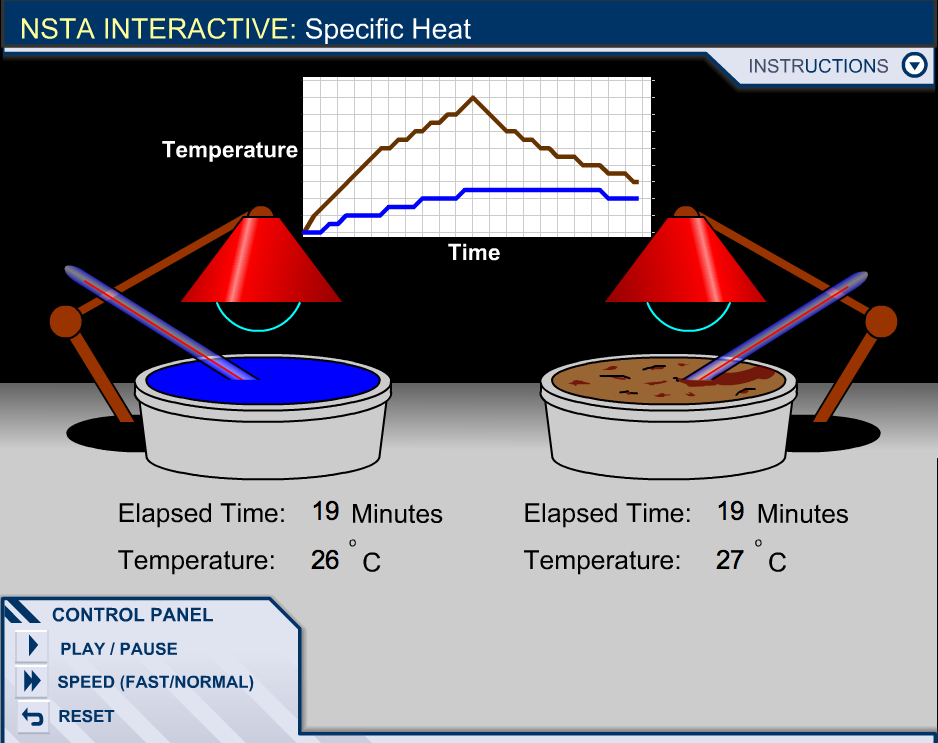
The image and animation to the left shows the specific heat changes in water and sand. As you can see the in graph and the animation sand heats up much quicker than water and reaches a higher temperature. But in comparison to water it also cools down much quicker. Water on the other hand is slow to increase in temperature but despite the source of heat be switched off retain heat for a significant period of time. This simple experiment that you could replicate in the lab tells us a lot about how oceans and continents differ in relation to insolation. This difference can be observed on a variety of timescales, including day and night and seasonal changes. For example, at the diurnal scale land temperature can significantly change, however the ocean remains quite constant. These changes can influence and create local weather conditions such as land sea breezes. In regard tolonger term annual changes, land temperature warms up much quicker in the summer and atmospheric temperature can be very high in continental locations. In contrast, places close to the sea generally remain cooler as the sea remains cooler. However as autumn arrives and winter begins the oceans maintain a mild climate through their specific heat retention, whilst continental positions might lose heat rapidly and experience much colder weather. These temperatures can be clearly seen in the Northern Europe data in the diagram below.
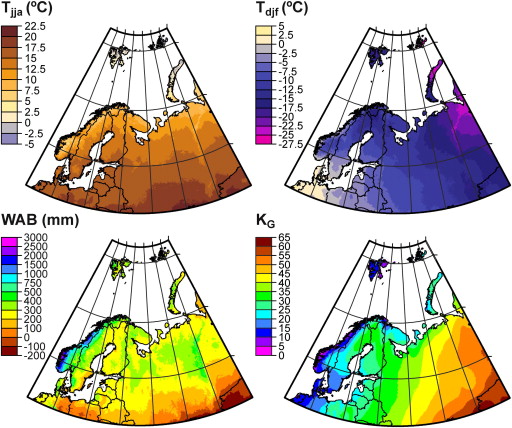
The Northern European climate grids for summer temperature (June-to-August mean, Tjja), winter temperature (December-to-February mean, Tdjf), annual water balance (WAB), and Gorczynski continentality index (KG). The grids were calculated based on the WorldClim monthly temperature and precipitation grids (Hijmans et al 2005). The visible pattern in Northern Europe is a clear temperature gradient that runs west to east. As one moves eastwards away from the Atlantic Ocean the land temperature increases in the summer and decreases significantly in th winter.
Altitude
As we have already seen in the diagram on the structure of the atmosphere, temperature falls with altitude. The diagram to left shows that temperature falls with increased altitude at a constant rate. In degree celcius and meters, the average temperature decrease is 6.5°C for every 1000 meters or 0.65°C for every 100 meters. The reality it is more complex and there are infact significant differences in rates of temperature decrease, known as lapse rates. For example dry air, which has low relative humdity cools a lot faster than moist air, which has high relative humidity. Dry air cools at a fixed rate of approximately 2-3°C per 300m. Moist air behaves differently as once it starts rising, the water vapour starts to condense. This change of water state releases latent heat and reduces the rate of cooling.
Air temperature derives its heat from radiation heating from contact with the Earth's surface. At lower altitudes there is effectively more ground surface for air to come in contact with than in higher altitudes. As a result, the higher the altitude the lower the amount of radiation received by the atmosphere. In addition, air at higher altitude is cooler because the pressure is lower. Gases expand at lower pressures. As a gas expands, the molecules (and atoms) within it move more slowly. Since air temperature is just a measure of how fast the molecules in air are moving, the rate of motion of molecules and the temperature are both lower at higher elevations. For a more detailed explanation read the following PDF on Altitude and Temperature.
Air temperature derives its heat from radiation heating from contact with the Earth's surface. At lower altitudes there is effectively more ground surface for air to come in contact with than in higher altitudes. As a result, the higher the altitude the lower the amount of radiation received by the atmosphere. In addition, air at higher altitude is cooler because the pressure is lower. Gases expand at lower pressures. As a gas expands, the molecules (and atoms) within it move more slowly. Since air temperature is just a measure of how fast the molecules in air are moving, the rate of motion of molecules and the temperature are both lower at higher elevations. For a more detailed explanation read the following PDF on Altitude and Temperature.
