|
|
|
The Global Impacts of Climate Change
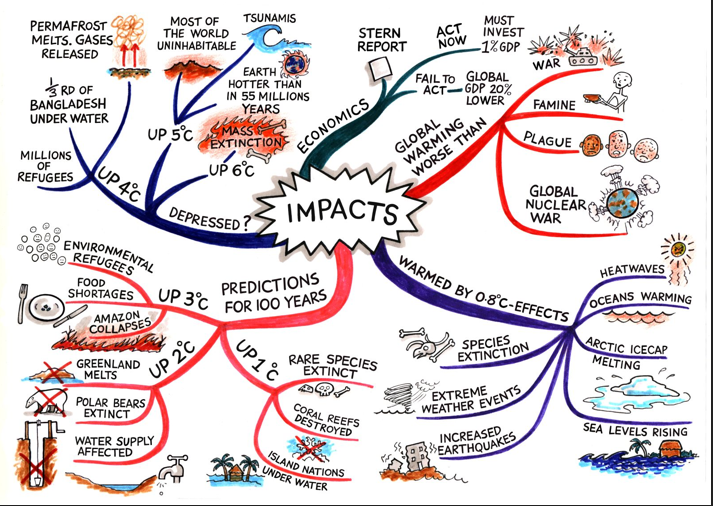
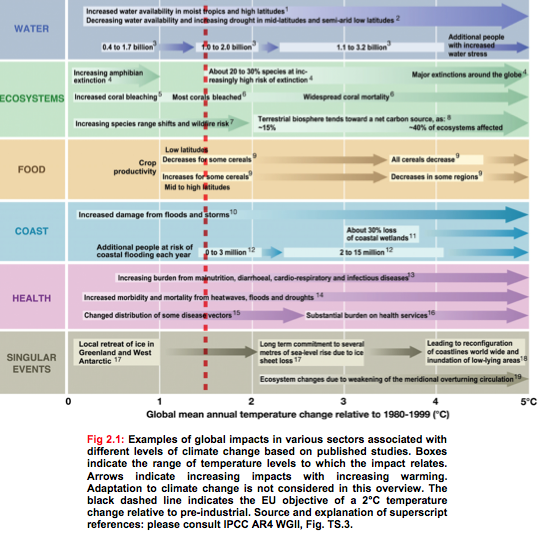
The discussion on impacts of climate change is filled with uncertainty. There is firstly great uncertainty on projected temperature rises and this inturn has a knock-on effect on the projected impacts. The latest IPCC reports reflect this uncertainty and are based on model temperature ranges linked to a number of different emission scenarios. Higher temperature rises are strongly linked with higher emissions and the longer the international community delays in making legally binding targets for cutting carbon emission the worse the scenarios become. For example there is now strong scientific consensus that without immediate legislation to cut global emissions the world is likely to exceed the 2°C target, above which the impacts become more painfull and irreversible.
|
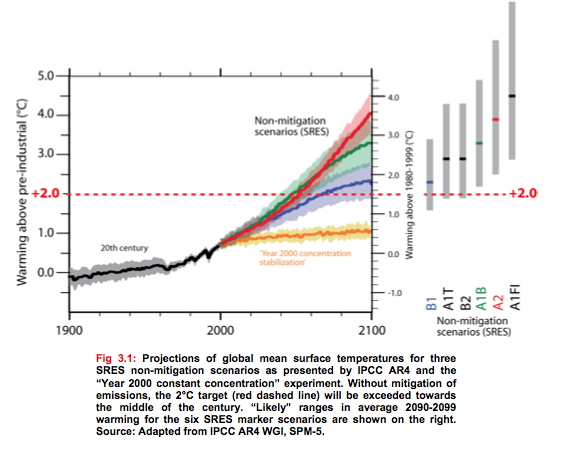
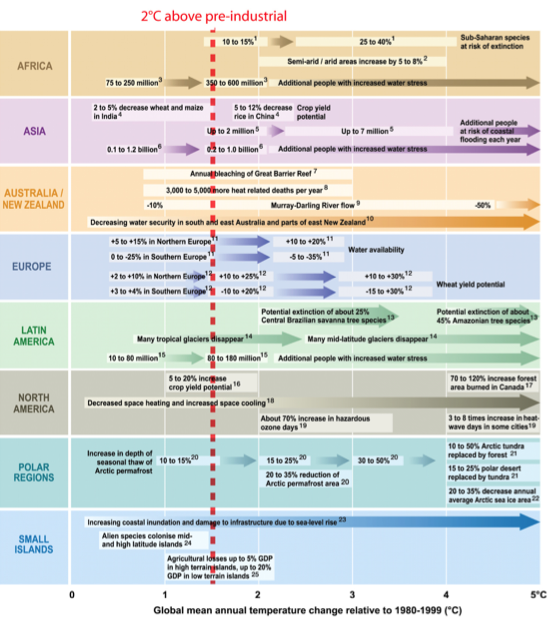
There is a significant regional variation in climate change and its impacts. In general, warming will be stronger over land areas than over the oceans, and some continents and regions will be subject to larger changes than others. For example the European Alps have experienced an average warming of 1.5°C compared to a global average of 0.8°C. In many regions, current differences in the distribution of precipitation tend to be amplified, i.e. wet regions generally will become wetter and dry regions will become drier. However the projected temperature increase is highly dependent on the various scenarios that we choose to take in regard to mitigation. The graphic to the right taken from the 2°C brochure produced by EG Science for the EU shows the various temperature rise scenarios including the range in the uncertainty from the models. At worst we can expect a 4.5°C increase by the end of the century, with many of the sceanrios suggesting an increase above the 2°C.
|
|
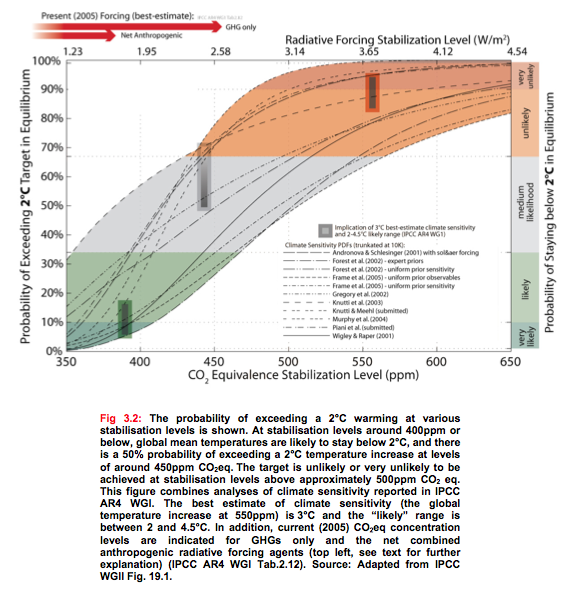
The following graphic shows the probability of exceeding the 2°C temperature rise target at various CO2 levels
Sea Level Rise
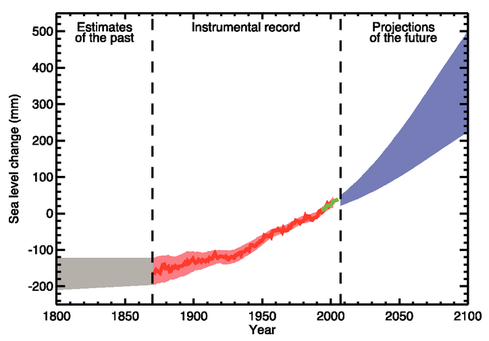
The following graph comes the 2007 IPCC report and shows the global mean sea level (deviation from the 1980-1999 mean) in the past and as projected for the future. For the period before 1870, global measurements of sea level are not available. The grey shading shows the uncertainty in the estimated long-term rate of sea level change. The red line is a reconstruction of global mean sea level from tide gauges and the red shading denotes the range of variations from a smooth curve. The green line shows global mean sea level observed from satellite altimetry. The blue shading represents the range of model projections based on various scenario for the 21st century, relative to the 1980 to 1999 mean, and has been calculated independently from the observations. Beyond 2100, the projections are increasingly dependent on the emissions scenarios. So what appears to be certain is a projected range of between 26 and 59 cm. However this projection excludes rapid dynamical changes in ice flow, that can lead to rapid melting events. This phenomena is explained in the Crock of the Week, by Peter Sinclair. The second video follows the heart breaking dilemna of Anote Tong, the President of the Republic of Kirabati as he contemplates the collapse of his country and culture. This can be used for local responses to climate change. The third video illustrates the impacts on the Alpine region of Europe but then goes on to look at sea level rise and other socio-economic impacts. The fourth video shows the well known problems of the low-lying country of Bangladesh and shows a local response of migration away from low lying coastal land to the city in Dhaka. It also deal with creative ways the local people have adapted to the impacts.
|
|
|
|
|
|
The first of these next two video show a negative response to the impacts of climate change and reveals the poiltical sensitivity of many communities to the impacts of climate change. This can be used to show a critical awareness of local responses to climate change.
|
|
|
This last video could be used to illustrate local responses to climate change.
The Impacts of Climate Change on West Bengal
With close economic ties to natural resources and climate-sensitive sectors such as agriculture, water and forestry, India may face a major threat, and require serious adaptive capacity to combat climate change. Impacts are already being seen in unprecedented heat waves, cyclones, floods, salinisation of the coastline and effects on agriculture, fisheries and health.
India is home to a third of the world’s poor, and climate change will hit this section of society the hardest. Set to be the most populous nation in the world by 2045, the economic, social and ecological price of climate change will be massive.
The future impacts of climate change, identified by the Government of India’s National Communications (NATCOM) in 2004 include.
- Decreased snow cover, affecting snow-fed and glacial systems such as the Ganges and Bramhaputra. 70% of the summer flow of the Ganges comes from meltwater
- Erratic monsoon with serious effects on rain-fed agriculture, peninsular rivers, water and power supply
- Drop in wheat production by 4-5 million tones, with even a 1ºC rise in temperature
- Rising sea levels causing displacement along one of the most densely populated coastlines in the world, threatened freshwater sources and mangrove ecosystems
- Increased frequency and intensity of floods. Increased vulnerability of people in coastal, arid and semi-arid zones of the country
- Studies indicate that over 50% of India’s forests are likely to experience shift in forest types, adversely impacting associated biodiversity, regional climate dynamics as well as livelihoods based on forest products.
The following video develop some of these impacts in more depth.
|
|
|
|
|
And to finish on a positive.
The Impacts of Climate Change on the UK and UK Policy
The impacts of climate change are complex and based on projections from models taking into a variety of emmission scenarios. The exact impacts of climate change are unclear within these projections. The following conclusions are clear.
- Projections are complex and based on models
- Projections are based on the probability of certain climate outcomes
- No one single projection is correct for the UK
- There is a clear north south divide
- There are flaws in some of the models
|
|
|
|
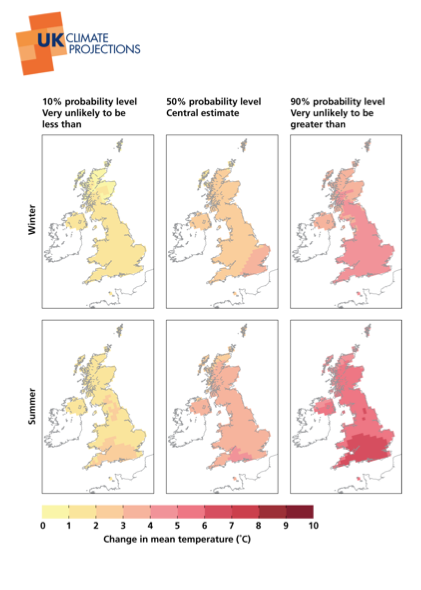
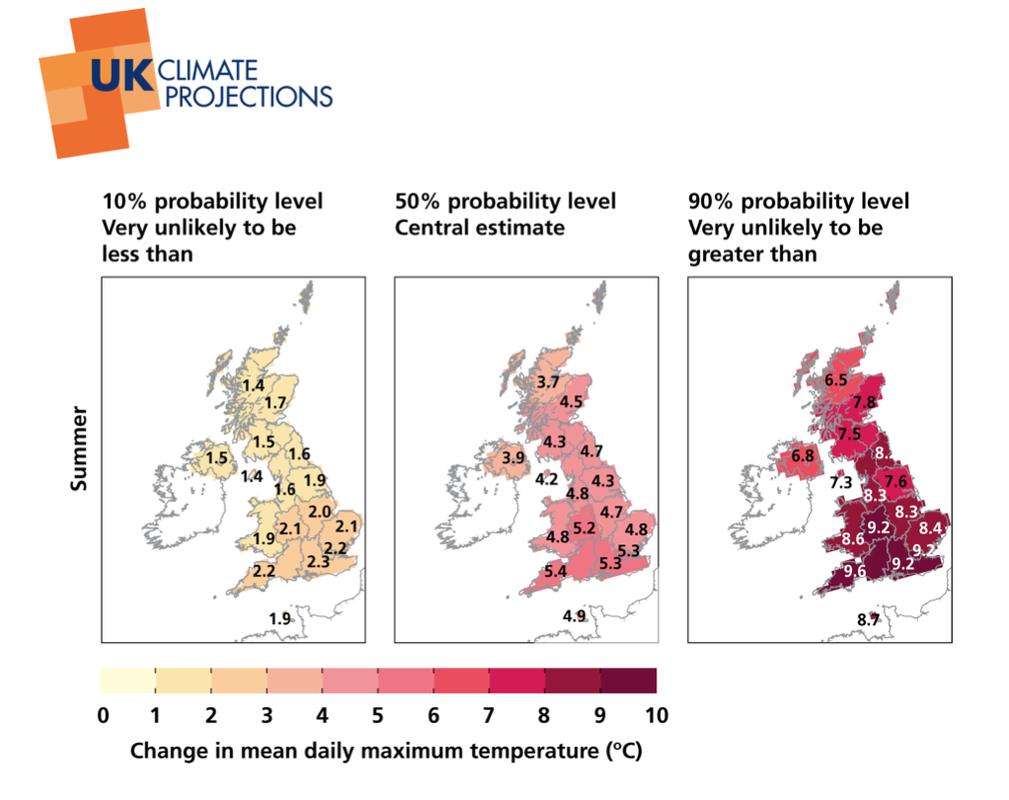
Temperature.
These projections are very difficult to pin down as they are based on probability. There are are number of clear conclusions on how temperature will change by 2080.
|
|
Precipitation
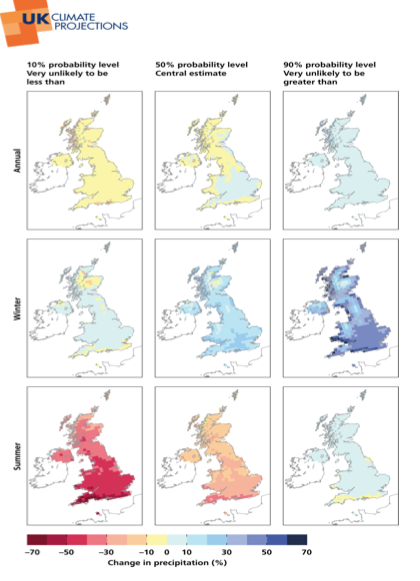
The projected changes in precipitation are also complex and based a probability for changes in precipitation by 2080. The most likely outcome is a marginal increase in precipitation of 10 percent in south England and Wales with coastal areas of the UK and northern England and Scotland all receiving a fall in precipitation of up to -10 percent. There is a clear difference between winter and summer. The Winter is likely to see net gains in precipitation of around 20 percent but the the summer is likely experience losses of between 20 and 30 percent. The following extract was taken from the UKCP09 report The central estimate of changes in annual mean precipitation (Figure 4.10) are within a few percent of zero everywhere. In winter, precipitation increases are in the range +10 to +30% over the majority of the country. Increases are smaller than this in some parts of the country, generally on higher ground, where there can even be slight decreases. In summer, there is a general south to north gradient, from decreases of almost –40% in SW England to almost no change in Shetland. |
|
Sea Level Rise
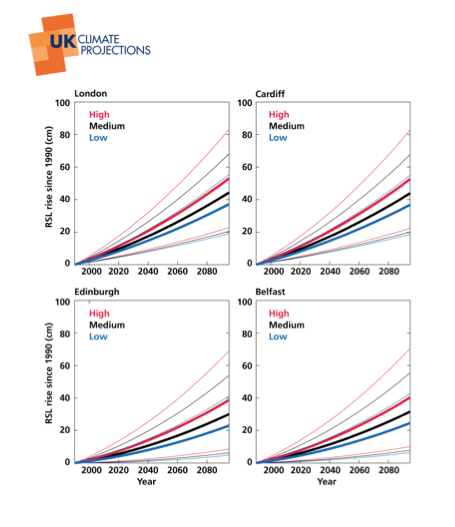
Regional divides on sea level rise are significant. South East England being most affected with central projections. There is a clear north south divide with London and Cardiff experiencing sea level rise projected at the central figure of 45 cm compared to 30 cm in Belfast and Edinburgh. The range of absolute sea level rise around the UK (before land movements are included) and across the three emission scenarios is projected to be between 12 and 76 cm for the period 1990–2095, which is a wider spread than that of the global average. The vertical movement of the land varies around the UK coastline. Taking this into account gives slightly larger sea level rise projections relative to the land in the more southern parts of the UK where land is subsiding, and lower increases in relative sea level for the north where in places land is uplifting. |
|
|
|
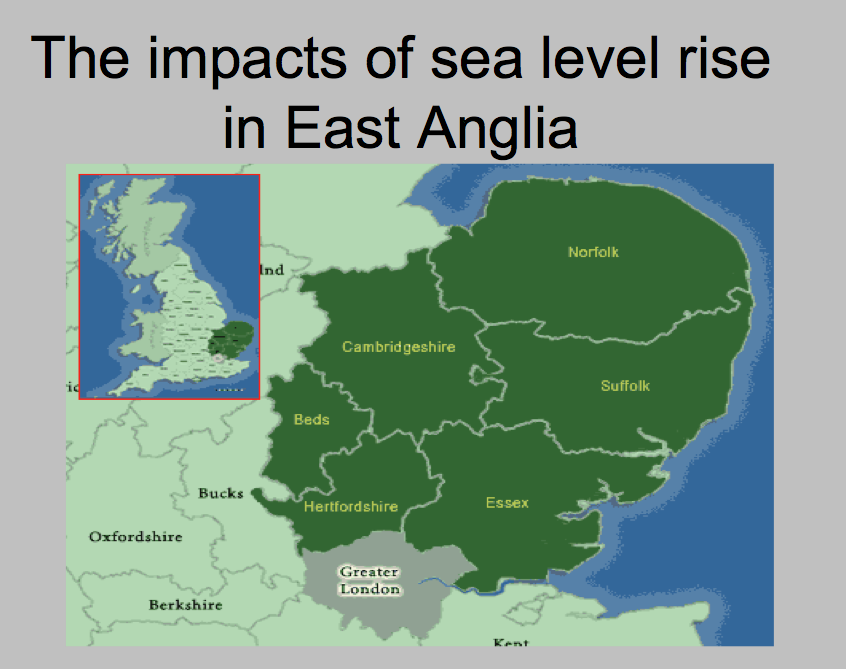
The following two case studies provide a detailed insight into the impacts climate change on the regions of Cumbria and East Anglia.
|
|
UK Climate Change Policy (National Scale Response)
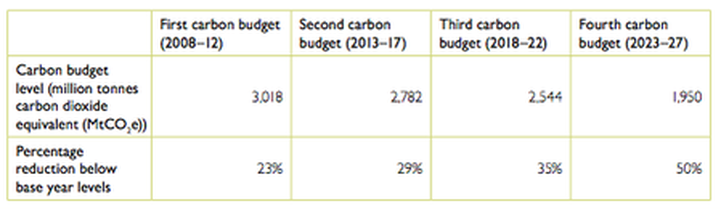
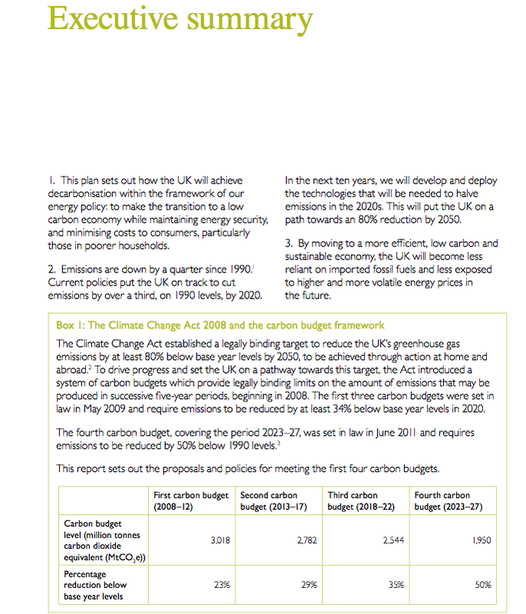
UK climate policy has two main threads, mitigation and adaptation. Mitigation refers to the reduction of carbon emissions an d in effect targets the UK's contribution to climate change. The key driving policy for mitigation is The Climate Change Act, which established a legally binding target to reduce the UK’s greenhouse gas emissions by at least 80% below base year levels (1990), by 2050. This is to be achieved through action at home and abroad. The Climate Change Act introduced a system of carbon budgets, which provide legally binding limits on the amount of emissions that may be produced in successive
five-year periods, beginning in 2008. The
first three carbon budgets were set in law in May 2009 and require emissions to be reduced by at least 34% below base year levels by 2020. The following diagram shows the first three carbon budgets.
The following strategy outlines some very sepcific projects aimed atredcuing UK's carbon emissions.
However, if the UK is to cut emissions by 80% by 2050, there will have to be major changes in how they use and generate energy. Energy efficiency will have to increase dramatically across all sectors. The oil and gas used to drive cars, heat buildings and power industry will need to be mostly replaced by electricity, sustainable bioenergy, or hydrogen. Electricity will need to be decarbonised through renewable and nuclear power, and the use of carbon capture and storage (CCS). The electricity grid will need to be larger and smarter at balancing demand and supply. However there are some major uncertainties. These include:
- to what extent can demand be reduced?
- What will be the scarcity or abundance of biomass?
- to what extent will electrification occur across transport and heating?
- to what extent will wind, CCS or nuclear be the cheapest method of generating large-scale low carbon electricity?
- how far can aviation, shipping, industry and agriculture be decarbonised?
- How will all this be paid for during a peiod of economic crisis and osterity measures?
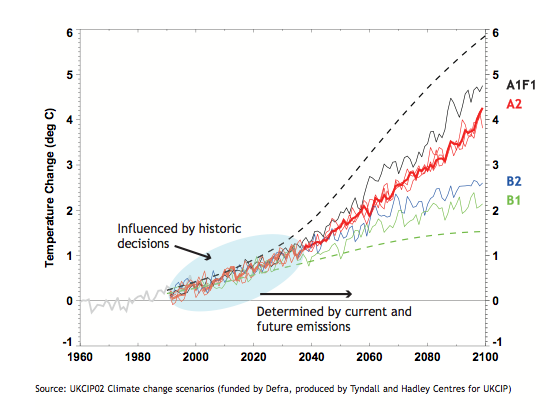
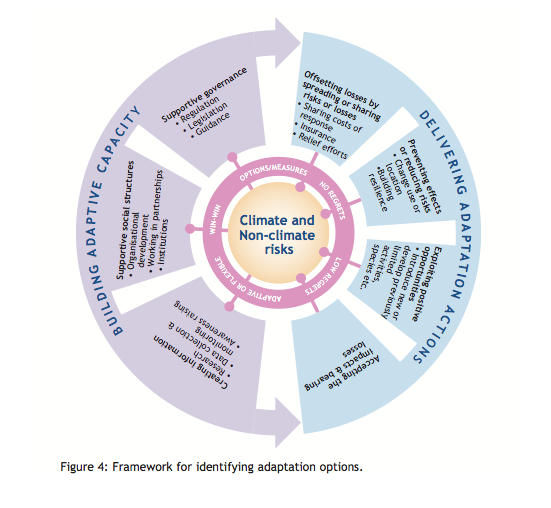
A second key element of UK policy is adaptation. The graph below shows historic and projected temperature rise based on a number of emission scenarios. It shows that our historic contribution of green house gases will lead to increases temperature regardless of mitigation efforts. The projected increases for 2050 will take place. This situation forces policy makers into an adaptive approach. The second diagram shows a how UK's daption wil be spily between building adaptive capacity and delivering adaptive actions.
|
|
The following two videos explain the Defra funded organisation, UKCIP who are the central agency in the UK approach to building adaptive capacity.
|
|
|
The following executive summary outlines in brief the UK's Carbon Plan. This paper outlines the UK policy to tackle carbon emissions. It's several pages long and well worth a read.
The following video explains the UK's Green Deal, which is an energy efficiency action for reducing emissiions from domestic buildings, that currently contribute 14 percent of the UK's total emissions.
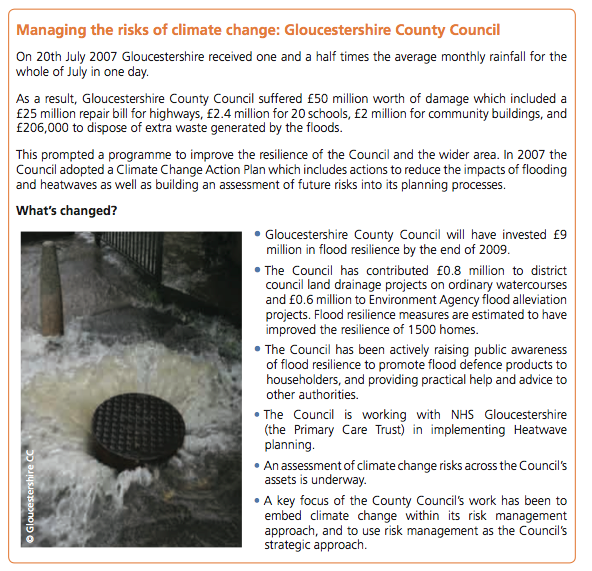
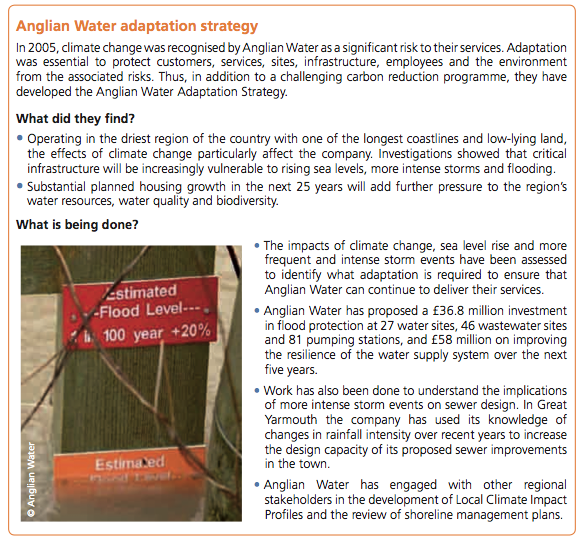
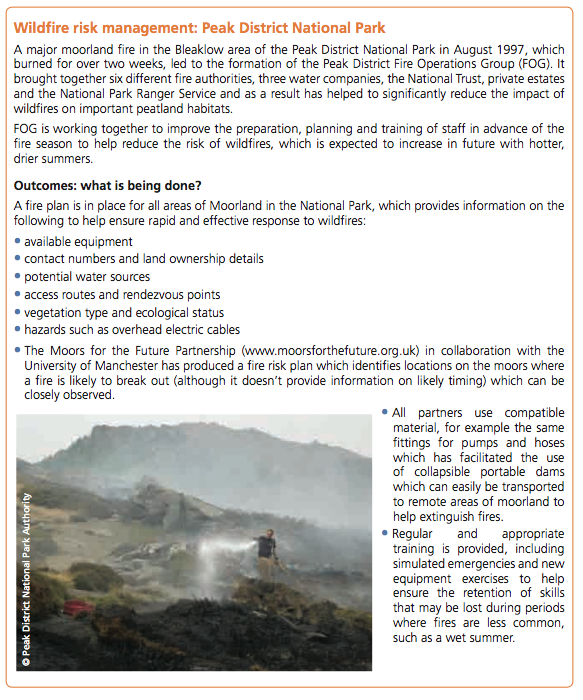
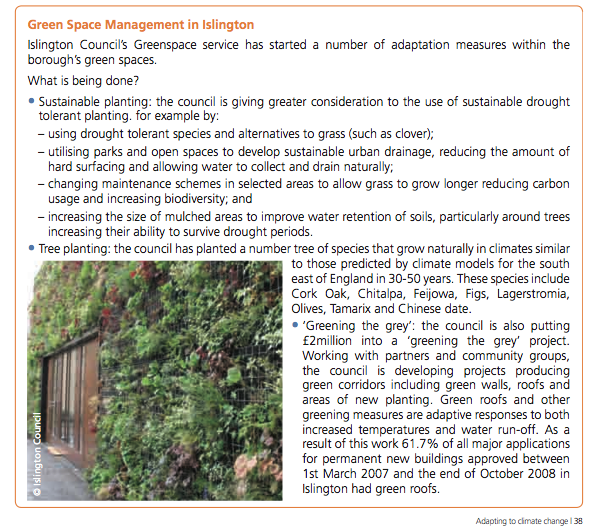
Below are four case studies of adaptation methods being deployed by organisations around the UK.
|
|
|
|
Local Responses to Climate Change
There have been many examples of local responses to climate change already developed in this section of the site. In answering a question specifically about local responses it would be best develop different place examples of the responses. At the local scale there are many examples of how civic society groups are working together in their local community to combat climate change. A good example of an organisation in the UK is Campaign to Protect Rural England. This organisation has worked tirelessly in its research, campaigns and action against the global food industry and the food miles and impacts on rural England. However for the purpose of this section I think it more important to focus on how people at the local scale, and by local scale I mean the village or the even the family responds and adapts to climate change. One of the most vulnerable regions to the impacts of climate change is the drought stricken regions of the Sahel. The following videos from a BBC World series focus on the problem of desertification in Niger and follow the problems and adaptations of a number of villages in different regions of the country, from basic fencing to prevent encroaching sand dunes to a project that has empowered women and brought back degraded land back into farming through simple but back-breaking soil mangement method known as tasas.
