|
|
|
Hydrographs, Recurrence Intervals and Basin Responses
Hydrographs
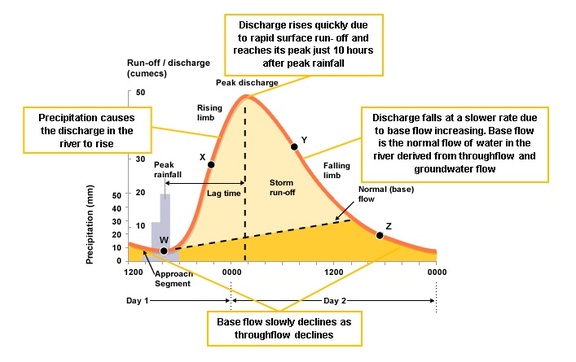
River hydrographs show how a river responds to precipitation events within its drainage basin. The hydrograph shows changes in discharge over time. Discharge is defined as the amount of water passing a given point at a given time. It's measured in cubic meters per second and can be calculated from field work data by multiplying cross-sectional area by average velocity. It is mainly collected from gauging sites located at different sites along the course of the river. These gauge sites feed data into one central data base and is managed by a state's environmental agency. The hydrograph is important for feeding in data on the potenital magnitude and frequency of floods. They are therefore a vital means to managing rivers and drainage basins.
Source: Adapted from BBC
In the hydrograph above we can see that discharge increases rapidly due to a period of extended rainfall. Hydrologists are most interested in the increase in discharge and the the lag time, which is the length of time separating peak rainfall from peak discharge. Point W on the graph marks the peak rainfall. At this moment, precipitation has not entered the river. After this point in time surface run-off will input water into the river. At point X surface run-off and discharge are increasing rapidly. At point Y discharge is in decline. Surface run-off is still feeding water into the river but it has also passed its peak. At point Z, there are no longer surface run-off inputs and throughflow and ground flow are both in decline. The discharge of the river is almost back to its minimum base flow.
Comparing Hydrographs
Rivers that have a rapid rise in discharge over a short period of time are said to have flash responses and produce a 'Peaky' graph. This is because water is mainly entering the river via surface run-off. Other rivers will have a more benign response to the same rainfall event. Their discharge will not rise so high and the lag time will be extended over a longer period of time. The graph will be much flatter. This is because more water is entering the river via throughflow and groundwater flow and less via surface-run-off. This has the effect of spreading out the flow over an extended period of time; hence the graph is flatter. The reasons for this can be explained by the characteristics of the drainage basin itself.
Drainage Basin Responses
The way that a river responds to a rainfall event has significant implications for its management. Flash responses lead to a very abrupt rise in discharge over a short period of time. This can lead to more frequent flood events. The characteristics of the drainage basin will explain how a river responds to a rainfall event.
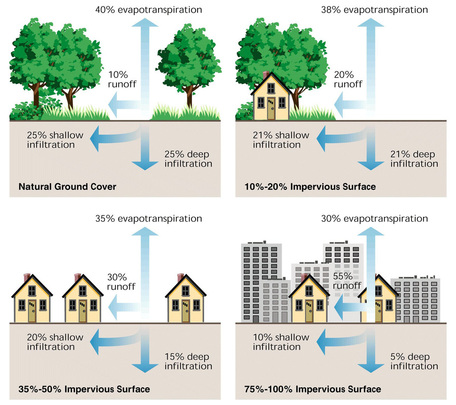
It is important at this point to consider how water enters the river again as this determines the likely lag time response of a river. Water enters the river through three main routes, surface run-off, throughflow and groundwater flow. Very little precipitation can fall directly into the channel so this can be discounted. Surface run-off is by far the fastest route to the river. Therefore, drainage basin factors that encourage surface run-off and limit infiltration are likely to lead to a more 'peaky' hydrograph. Deciduous forest in the summer increases rates of transpiration by as much as 40%. This is achieved through interception. Water often doesn't even reach the surface. Vegetation therefore restricts surface run-off by reducing the quantity of water reaching the surface. The speed at which precipitation reaches the surface is also slowed down by the forest canopy. Rainfall reaches the surface via the canopy in a process known as throughfall. This slow transfer of water to the surface is more likely to lead to infiltration and percolation rather than surface run-off. Any type of human development that then removes dense forest vegetation is likely to increase surface run-off. The close negative relationship between vegetation density and surface run-off can be seen in the diagram below. Likewise, we can also see the positive relationship between increased impervious surfaces, associated with urbanisation and increased surface run-off.
It is important at this point to consider how water enters the river again as this determines the likely lag time response of a river. Water enters the river through three main routes, surface run-off, throughflow and groundwater flow. Very little precipitation can fall directly into the channel so this can be discounted. Surface run-off is by far the fastest route to the river. Therefore, drainage basin factors that encourage surface run-off and limit infiltration are likely to lead to a more 'peaky' hydrograph. Deciduous forest in the summer increases rates of transpiration by as much as 40%. This is achieved through interception. Water often doesn't even reach the surface. Vegetation therefore restricts surface run-off by reducing the quantity of water reaching the surface. The speed at which precipitation reaches the surface is also slowed down by the forest canopy. Rainfall reaches the surface via the canopy in a process known as throughfall. This slow transfer of water to the surface is more likely to lead to infiltration and percolation rather than surface run-off. Any type of human development that then removes dense forest vegetation is likely to increase surface run-off. The close negative relationship between vegetation density and surface run-off can be seen in the diagram below. Likewise, we can also see the positive relationship between increased impervious surfaces, associated with urbanisation and increased surface run-off.
Urbanisation and Surface Run-off
We need to be careful not to exaggerate the importance of urbanisation in creating flash responses in rivers; afterall the city or town only represents a small area of the drainage basin as a whole. The construction of roads and parking lots does of course increase run-off as well as the building of houses and businesses on the floodplains. In addition, the design of roads and drainage infrastructure to transport water quickly into the river further reduces lag time. However, with the exemption of major metropolitan areas, these impacts need to be observed more generally at a local scale. On their own they are not soley responsible for flooding. Furthermore, river management is often deployed in built up environments to reduce the likelyhood of flooding. Moreover, the impact of urbanisation is often one that exacerbates flooding downstream of the city. However, it must be recognised that the combined effect of urbanisation and agricultural development, which has stripped the countryside of its natural forest is chiefly responsible for the large scale floods that appear to be more frequent today.
The Influence of Relief and Geology
Source: BBC
Drainage basin characteristics or basin controles can influence the shape of the hydrograph. These include the size, shape, steepness of slopes and the type of geology. If slopes are gentle to flat, rainfall is more likely to pool on the surface and infiltration will take place. If slopes are angled and steep, then rainfall is likely to run-off. As can be seen in the hydrograph discharge will force the rising limb to be much steeper where slopes are steep. The rising limb will be much flatter where the land itself is flat. The rock type of the area is an important factor. Impermeable rock, which prevents percolation will encourage throughflow and surface run-off. This will be more pronounced in areas of shallow compact soils. Permeable rocks, such as limestone allow water to percolate through. This in turn leads to higher ground water storage and flow. As a result discharge remains low and the lag time more extended. Drainage Basins with impermeable underlying rock are also associated with higher drainage density on the surface. Drainage density refers to the density of river channels and tributaries. A higher drainage density is a consequence of impermeable underlying rock. The effects of geology and the differences in permeability can be seen in the two contrasting hydrographs and corresponding drainage densities in the diagram below.
Source: BBC
Basin Shape
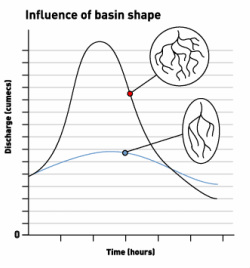
Source: BBC
The shape of the basin is also an important factor influencing the shape of the hydrograph. The larger the drainage basin the slower a river is to respond. This is due to the distance that water has to travel via its paths of surface run-off, throughflow and groundwater flow. Water has less distance to travel in small drainage basins. The shape of drainage basin also influences river responses. Circular drainage basins with dendritic and high drainage density have more rapid responses. Water takes more time to reach the river in long narrow drainage basins.
River Regimes
When studying the way a river responds to its precipitation inputs it is important to consider the climatic factors of the drainage basin. The number of seasons a region has will directly influence the discharge of the river throughout the year. The regime of a river represents the average annual discharge of a river and whilst we have seen that annual discharge varies considerably over time, the regime is an important resource for understanding the nature and responses of a drainage basin. In the example adjacent we can see four different river regimes each characterised by the climatic characteristics of its situation.
See if you can match each graph to its corresponding climatic condition!
See if you can match each graph to its corresponding climatic condition!
Recurrence Intervals
Source: USGS
Another resource available to hydrologists is the recurrence interval of rivers. The recurrence interval records the peak annual discharge of river over time and when graphed, we are able to observe clear patterns. In this graph we can see the annual peak discharge for the Tar River in Tarboro, USA. In addition to identifying the 50 and 100 year flood event we are also able to see the 5 year moving average. This is to say that approximately every 5 years the Tar River experiences an above average annual discharge. It is important to stress that recurrence intervals are not a means for prediction but rather they work with the probability of a floods of a particular magnitude occuring. The formula for calculating the recurrence interval is hown in the diagram below.
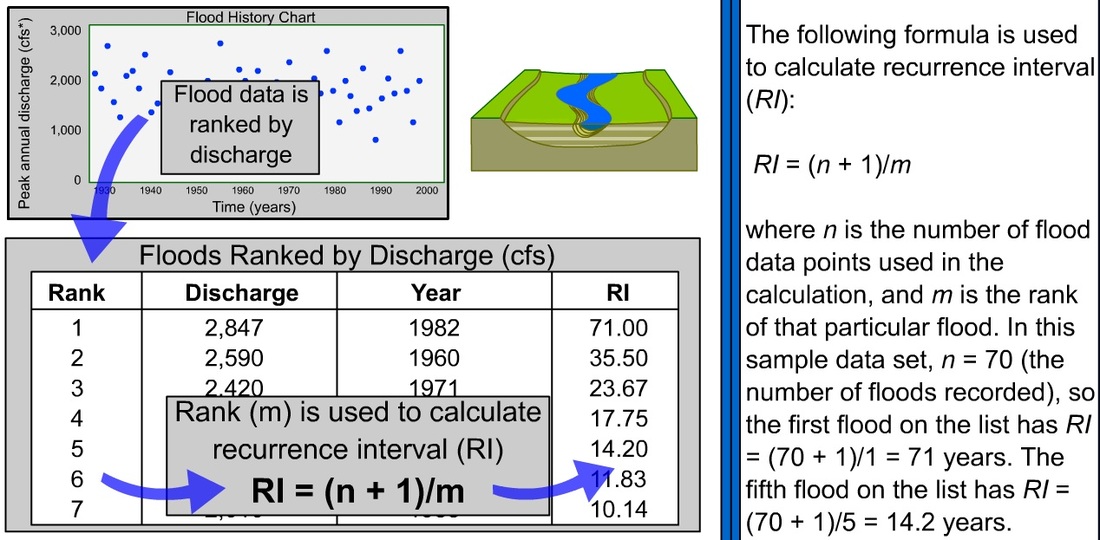
Source: www.as.uky.edu
Click here for further reading
